
ISSN (0970-2083)
ISSN (0970-2083)
Kaushal Kishore*
Materials Engineer, Roorkee, U.K., India
Visit for more related articles at Journal of Industrial Pollution Control
In the production of cement considerable amount of CO2 is emitted in the atmosphere. With the use of water reducers same construction may be done with less cement. Thus les cement will be required to be produce by cement factories resulting less CO2 will be emitted into the atmosphere. The paper gives method of mix design with water reducers.
CO2, Cement, Flyash, Water reducers, Mix design, Pollution
In India 0.93 kg of CO2 is emitted in the production of one kg of cement. In the financial year 2009-10 India produces 200 million tonnes of cement. In the production of this cement 186 million tonnes of CO2 was emitted in the atmosphere during financial year of 2009-10.
The availability of water in India per person per year in 1950 was 5177 cu.m. In the year 2009 it is reduces to 1700 cu.m.
If 50 million tonnes cement in making concrete uses water reducers 7500000 tonnes of cement can be saved. 3750000 kL of potable water will be saved and the saving of Rs. 3300 crores per year to construction industry. This amount is worked out after adjusting the cost of water reducers. Less cement used means less cement required to be produce by the cement factories resulting 6975000 tonnes of CO2 will be prevented to be emitted to the atmosphere. These are worked out with an average saving of 15% cement and 15% water.
CO2 emission is a global problem, but for India in addition to CO2 it has problems of Air, Water, Soil, Food and Noise pollutions. Less densily populated countries may cope with these problems but for India it is of the top concern. The population figures of 2009 is, India 350 person per sq.km, China 132 person per sq.km and USA only 34 person per sq.km. The figures of 2006 CO2 emissions are USA 658.60 tonnes per sq.km, China 611.76 tonnes per sq.km and India 459.35 tonnes per sq.km. Every one should contribute his or her efforts to save the environment from pollution. Those involved in the construction activities can contribute their share by proper design of concrete Mixes. This is best illustrated by the following examples
1. The grading of fine aggregate, 10 & 20 mm aggregates are as given in Table 1. Fine aggregate is of zone-II as per IS:383-1970. 10 and 20 mm crushed aggregate grading are single sized as per IS: 383-1970.

Table 1. Grading of aggregates
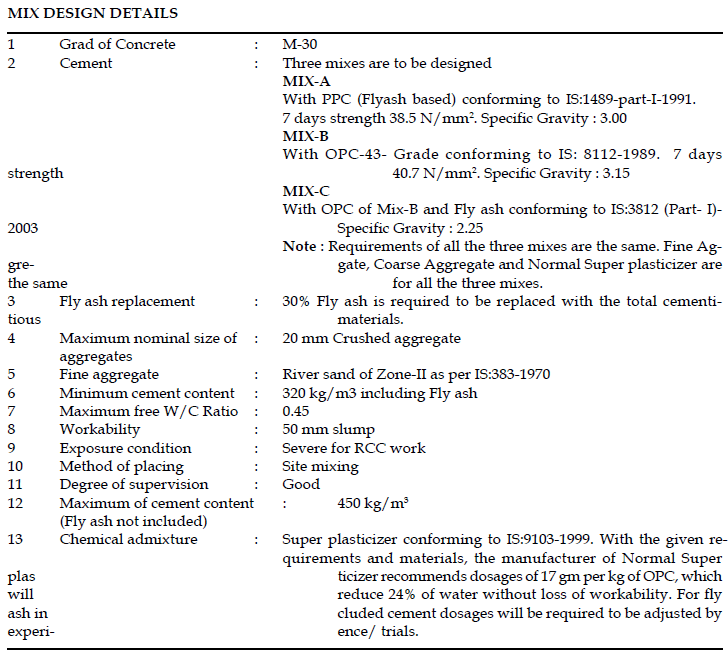
2. Properties of aggregates
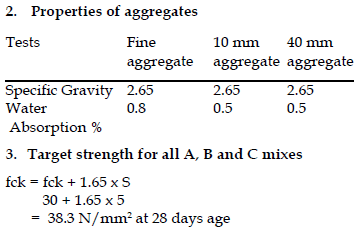
4. For Mix A and B free W/C ratio with crushed aggregate and required target strength of 38.3 N/ mm2 at 28 days from Fig. 1 Curve D found to be 0.45. Taking into the consideration of water in admixture, let it be 0.44. This is lower than specified maximum W/C ratio value of 0.45.
Note:
In absence of cement strength, but cement conforming to IS Codes, assume from Fig. 1 and 2.

Fig. 1 Relation between free water / cement ratio and concrete compressive strength for different cement stremgth using crushed aggregate

Fig. 2 Relation between free water / cement ratio and concrete compressive strength for different cement stremgth using uncrushed aggregate
Curve A and B for OPC 33 Grade
Curve C and D for OPC 43 Grade
Curve E and F for OPC 53 Grade
Take curves C and D for PPC, as PPC is now being manufactured in minimum of 43 Grade of strength.
5. O ther data’s: The Mixes are to be designed on the basis of saturated and surface dry aggregates. At the time of concreting, moisture content of site aggregates are to be determine. If it carries surface moisture this is to be deducted from the mixing water and if it is dry add in mixing water the quantity of water required for absorption. The weight of aggregates are also adjusted accordingly.
a) Free W/C ratio for the target strength of 38.3 N/ mm 2 as worked out is 0.44.
b) Free water for 50 mm slump from Table 2 for 20 mm maximum size of aggregate.

Table 2. Approximate free-water content (kg/m3) required to give various levels of workability for non-air-entrained (with normal entrapped air) concrete.
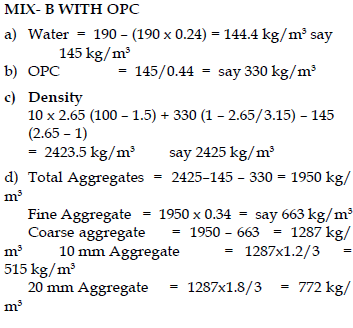
From trials it is found that Normal Super plasticizer at a dosages of 20gm/kg of cement may reduce 24% water without loss of workability
Then water = 190 – (190 x 0.24) = 144.4 kg/m3 for trials say 145 kg/m3
c) PPC = 145/0.44 = 329.5 kg/m3
Say 330 kg/m3. This is higher than minimum requirement of 320 kg/m3
d) Formula for calculation of fresh concrete weight in kg/m3
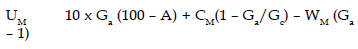
Where,
Um = Wight of fresh concrete kg/m3
Ga = Weighted average specific gravity of combined fine and coarse aggregate bulk, SSD
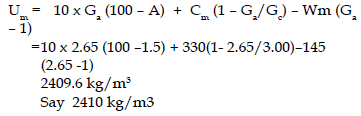
Gc= Specific gravity of cement. Determine actual value, in absence assume 3.15 for OPC and 3.00 for PPC (Fly ash based)
A = Air content, percent. Assume entrapped air 1% for 40 mm maximum size of aggregate, 1.5% for 20 mm maximum size of aggregate and 2.5% for 10mm maximum size of aggregate. There are always entrapped air in concrete. Therefore ignoring entrapped air value as NIL will lead the calculation of higher value of density.
Wm = Mixing water required in kg/m3
Cm = Cement required, kg/m3
Note: The exact density may be obtained by filling
and fully compacting constant volume suitable metal container from the trial batches of calculated design mixes. The mix be altered with the actual obtained density of the mix.
e) aggregates = 2410 – 330 – 145 = 1935 kg/m3
f) Fine aggregate = From Table 3 for zone-II Fine aggregate and 20 mm maximum size of aggregate, W/C ratio = 0.44, 50 mm slump (Low Work- ability) found to be 34%.
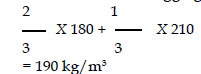
Fine aggregate = 1935 x 0.34 = 658 kg/m3 Coarse aggregate = 1935 – 658 = 1277 kg/m3 10 and 20 mm aggregate are single sized as per IS: 383-1970. Let they be combined in the ratio of 1.2:1.8 to get 20 mm graded aggregate as per IS: 383-1970
10 mm aggregate = 510 kg/m3
20 mm aggregate = 767 kg/m3
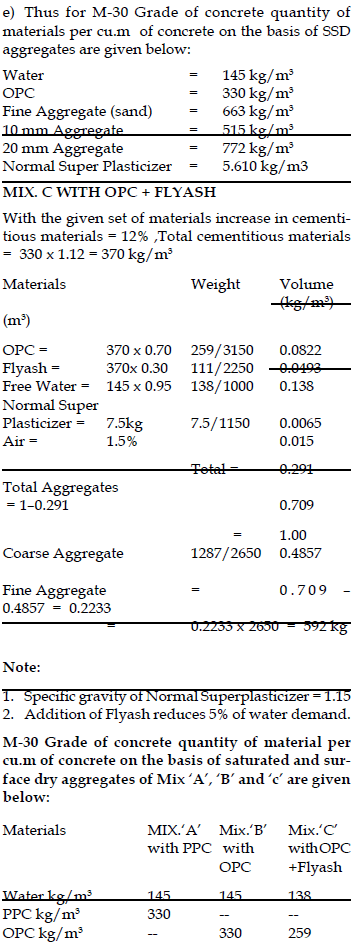
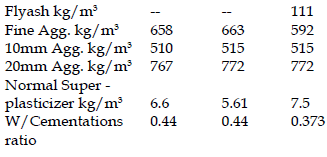
g) Thus for M-30 Grade of concrete quantity of materials per cu.m. of concrete on the basis of saturated and surface dry aggregates:
Water = 145 kg/m3
PPC = 330 kg/m3
Fine Aggregate (sand) = 658 kg/m3
10 mm Aggregate = 510 kg/m3
20 mm Aggregate = 767 kg/m3
Normal Super Plasticizer = 6.6 kg/m3
cement is 92 kg/m3 and water 45 lit/m3 for PPC and OPC.
3. In the Fly ash concrete the saving in cement is 163 kg/m3 and water 52 lit/m3 including utilization of 111 kg/m3 of fly ash witch is a waste material.

Table 3. Proportion of fine aggregate (percent) with 10mm and 20mm maximum sizes of aggregates and with different workability.

Table 4. Proportion of fine aggregate (percent) with 40 mm maximum sizes of Aggregates and with different workability.
4. If 50 million tonnes cement in making concrete uses Water Reducers 7500000 tonnes of cement can be saved. 3750000 KL of potable water will be saved and the saving of Rs. 3300 crores per year to the construction Industry. 6975000 tonnes of CO2 will be prevented to be emitted to the atmosphere. The benefits in the uses of water reducers not limited to this. When water reduces shrinkage and porosity of concrete are reduces which provides the durability to concrete structures.
6. India is facing serious air, water, soil, food and noise pollution problems. Every efforts therefore are necessary to prevent pollution on top priority basis.
Copyright © 2024 Research and Reviews, All Rights Reserved