
ISSN (0970-2083)
ISSN (0970-2083)
Centre of Mining Environment, Indian School of Mines Dhanbad, India
Visit for more related articles at Journal of Industrial Pollution Control
The emphasis of large-scale opencast mining has resulted in widespread concern about the deterioration in environmental quality, specially the increase in concentration of Suspended Particulate Matter (SPM) within and around the mining site. SPM, which is the primary pollutant from the surface mining operations is emitted due to blasting, excavation, transportation, material transfer, wind erosion of loose soil, overburden dump, etc. Thus, to gain better understanding of the fate and transport of the pollutants and to predict future conditions under various inputs and management action alternatives, the mathematical simulation of the dispersion process is an important exercise. For this, application of the EPA models for the short-term prediction of the pollution level due to mining activities was explored. The two models considered in the study are Industrial Source Complex Short-Term (ISCST3) and Fugitive Dust Model. The emission inventory and meteorological data are primary inputs for an air quality model. Various statistical approaches were used to compare and evaluate the models under study and it was found that FDM is more accurate then ISCST3 and thus is more useful as a screening tool for regulatory purposes.
Dispersion models fdm, Suspended particle, (ISCST3).
Air quality models are powerful tools to predict the fate of pollutant gases or aerosols upon their release into the atmosphere. The models account for the dilution effects of the wind speed and turbulent diffusion. It is imperative that these dispersion be properly evaluated with the observational data before their predictions can be used with confidence, because the model result often influence decisions that have large public health and economic consequences. As per EIA Notification 1994, mining projects require environment clearance from Ministry of Environment and Forests, Government of India. Air quality impact assessment requires a critical decision to be made regarding the selection of the appropriate model for impact prediction and a large number of models are being used. These models vary in their approach towards the estimation of impacts. This paper presents the capabilities of the two Gaussian dispersion based United States Environmental Protection Agency (USEPA) models namely- Fugitive Dust Model (FDM) USEPA-1992 and Industrial Source Complex Short Term Model (ISCST3) USEPA-1995. These models were used for simulating the short-term pollution levels due to mining operations and its application in Indian context. Various statistical methods like- Index of agreement (d), Fractional Bias (FB), Normalized Mean Square Error (NMSE), Geometric Mean Bias (MG), and the fraction of predictions within a factor of two of observations (FAC2) were used in the model comparison and evaluation with reference to the observed data on Suspended Particulate Matter (SPM) concentration and the respective predicted values using the two models.
Models under study
ISCST3
The Industrial Source Complex Short Term Model is a steady-state Gaussian plume model which can be used to assess pollutant concentration from a vide variety of sources associated with an industrial source complex. Emission sources are categorised into four basic types of sources, i.e., Point, Volume, Area, and Open Pit sources. The volume source option and the area source option may also be used to simulate line sources. The ISCST3 model estimates the concentration or deposition value for each source and receptor combination for each hour of input meteorology and calculates user selected short-term averages. The input data for the model are user source dimension, emission rates, wind speed, wind direction, ambient air temperature, mixing height, stability class, and receptor coordinates (USEPA, 1995 Users Guide for ISCST3).
Fugitive dust model (FDM)
The Fugitive Dust Model has been specifically designed for computing concentration and deposition impacts for fugitive dust sources. The sources may be point, line or area sources. The model has not been designed to compute the impacts of the buoyant point sources; thus it contains no plume rise algorithm. The model is generally based on the well-known Gaussian Plume formulation for computing concentrations, but the model has been specifically adapted to incorporate an improved gradient transfer deposition algorithm. Emissions for each source are apportioned by the user into a series of particle size classes. A gravitational settling velocity and a deposition velocity are calculated by FDM for each class. Concentrations and depositions are computed at all user selected receptor locations. Up to 500 receptors and 200 sources can be processed.
The sources can be of three types: point, line or area. The line source and area source algorithms are based on algorithms in the CALINE3 model. For area sources, the user supplies the coordinates of the Centre and the dimension in the x and y directions. Area sources need not be square, but rather can be rectangular, up to an aspect ratio of 1 to 5 (ratio of width to length). Area sources with the length greater than five times the width must be divided in a series of area sources, or modeled as a line source. The model divides the area source into a series of line sources perpendicular to the wind direction (USEPA, 1992, Users guide for FDM).
Test case- Codli iron ore mine
The monitoring has been carried out at Codli Iron Ore mine situated at Codli- Dharbandora village of Sanguem Taluka, South Goa District. The work has been carried out by TERI under the EMCBTA project: Mining subcomponent II, executed by CME/ISM. The reserves for Codli mine are 52.3 million tones. The annual production of ore from Codli mine is 3 million tones while that from PTI mine is 0.3-0.4 million tones per annum. The annual average rainfall in the area is about 4000mm. The main emission sources for dust in the open cast mining operations are: exposed pit surfaces, haul roads, loading and unloading operations for the overburden as well as ore, exposed overburden dumps, stock yard for ore as well as product, processing plant, workshop area. The diagrammatic representation of the study area is shown in Fig. 1.

Fig 1 Site layout for Codli Mining area (Source TERI Project Report No. 2001EE61)
Air quality monitoring
The air quality monitoring has been carried out throughout the day, twice a week at each station. Four-weeks monitoring had been carried out in the winter season. The air quality monitoring was carried out at intervals of 8 hours each so as to correspond to the working shifts of the mine using High Volume Samplers (HVS) , with an average flow rate of > 1.1 cubic meter per minute.
Emission factor
Emission factor is a representative value that attempts to relate the quantity of pollutant released to the atmosphere with an activity associated with the release of that pollutant. These factors are usually expressed as the weight of pollutant divided by a unit weight, volume, distance, or duration of the activity emitting the pollutant. Such factors facilitate estimation of emission from various sources of air pollution. For estimating the line and area sources the empirical equations by Chakraborty et al. (2002) (shown in Table1) were used as this was developed typically for Indian Environmental conditions. For haul road emission estimation the USCPN AP-42 (Final section- Supplement E, Sept. 1998) were relied upon.

Table 1 Empirical formulae for emission rate of each activity
Meteorological Observations
Onsite meteorological data for wind speed, wind direction and temperature was collected by TERI for all the three seasons and used as input to the models. In addition, appropriate corrections related to wind direction were incorporated. The FDM model requires wind direction in degrees from North from which wind is blowing. In case of ISCST 3 model, wind direction is reported in terms of the direction towards which the wind is blowing. The atmospheric stability categories (in terms of A-F) were determined on the basis of Turners classification based on wind speed, insolation and state of the sky (Turner, 1969 as cited in Wark and Warner, 1976). The mixing height values for Goa are based on earlier studies conducted by Viswanadham and Santosh (1989), and Padmananabhamurthy and Gupta (1984).

Table 1 Statistical analysis Results for Models evaluated
Model evaluation
Various statistical approaches were used for the validation of these two models. Bencala and Seinfeld (1979), Juda (1986), Luhar and Patil (1989), and McRae and Seinfield (1983) used mean, standard deviation, regression constant and coefficient and difference measures for the validation of models. The mean values of observed and predicted concentrations indicate the position of central value about which the measurements are distributed and these should be as close as possible for a good model. The standard deviation indicates how closely the data are dispersed. Regression analysis depicts the relationship between observed and predicted concentration and it is difficult to interpret models performance based on these analyses only. Willmot and Wicks (1980) and Willmot (1982) observed that a small change in the observed and predicted concentration may result in negative correlation; hence they recommended the use of index of agreement d, which indicates the accuracy involved in model prediction. Hanna et al. (1993) recommended the use of statistical performance measures, which include the fractional bias (FB), the geometric mean bias (MG), the normalized mean square error (NMSE), and the fraction of predictions within a factor of two of observations (FAC2). In the present study the model evaluation will be done using index of agreement (d), FB, MG, NMSE and FAC2:
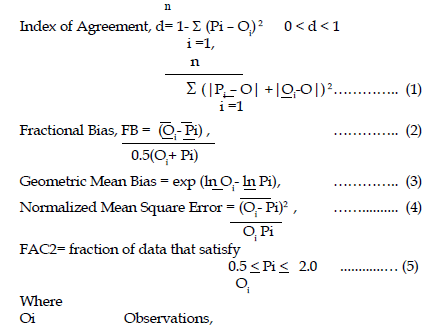
Pi Model Predictions,
Overbar average over the dataset
A perfect model would have the value of index of agreement (d), geometric mean bias (MG), fraction of predictions within a factor of two(FAC2) = 1.0; and fractional bias (FB) and normalised mean square error (NMSE) = 0.The models predictions were grouped under “underprediction”, “exact prediction” and “overprection” for assessing their performance.
The predicted average concentration levels of SPM at the 7 sites during winter season ranged from 243-594μg/m3 and 604-1038 μg/m3 using the FDM and the ISCST3 models respectively. During summer season the predicted average concentration level of SPM at these sites ranged from 229-612 μg/m3 and 357-929μg/m3 and during post monsoon the predicted average concentration at the sites ranged from 21-93μg/m3 and 102-485μg/m3, using the FDM and ISCST3 models respectively. From the observed and predicted mean values it is inferred that the model predictions are better for FDM as compared to ISCST3. Considering the average values at each of the monitoring stations, 17 out of 21(81%) values lie within a factor of 2 for FDM during all the season. However, in the case of ISCST3 model, only 7 out of 21 (33%) values lie within a factor of 2.The index of agreement, d indicated that the accuracy of the model is 82% for FDM while only 44% for ISCST3. The normalized mean square error indicated that there was less error in FDM compared to ISCST3 results.
In this study, performance evaluations of two Gaussian models were evaluated for an open cast mine site for different seasons in a year. The fugitive dust model (FDM) performed relatively much better compared to the Industrial Source Complex- Short Term (ISCST3) model. The prediction accuracy of FDM is 82%, which is much better then the prediction accuracy of ISCST3 model. It can be concluded that FDM could be used for making ambient air quality predictions for open cast mining operations. The model could provide important inputs for the development of air quality management plans and explore the effectiveness of various control strategies.
Authors gratefully acknowledge the financial support of MOEF/GOI for this study. One of the authors (Jyoti Prabha) is thankful to Prof. T. Kumar, Director, ISM for award of ISM Research Fellowship.
Copyright © 2024 Research and Reviews, All Rights Reserved