Keywords
|
| Hydro remediation, Groundwater, Transport model, Visual MODFLOW, Pollution prediction, Total Dissolved Solids |
INTRODUCTION
|
Problem definition
|
| Development of micro level model depicting actual hydro geological characteristics and village wise contamination profiles can be very useful in predicting the plume movement more accurately. It can provide a framework for implementable village level remedial actions. Ambur sub basin is taken for the study, as this area is severely contaminated by uncontrolled disposal of treated and untreated tannery effluents with TDS level ranging from 2000 – 18000 mg/L for more than 40 years. In this sub basin 30000 m3 of treated and untreated effluents are disposed per day into land, river and other water bodies. Groundwater in 29 of the total 49 sample villages has become unfit for irrigation as well as domestic use. |
1.2 Objectives
|
| The objectives of this study are: study of the highly polluted unconfined aquifer system through construction of steady state and transient state three dimensional flow models and transport models using Visual MODFLOW, prediction of pollution spread for the next 30 years from the initial year 2012, and simulation of hydro remediation through check dams and study of its impact. |
STUDY AREA
|
General
|
| The study area, Ambur sub basin is delineated from Survey of India topo sheets 57L/9, 57L/10, 57L/13 and 57L/14 and it lies in between longitudes 78?33’19” and 78?48’48” East and latitudes 12?39’0.44” and 12?45’19.36” North. It measures 394.4 km2. It is located as shown in Figure 1 in Vellore district, Tamilnadu, India. The Ambur sub basin comprises the parts of Pernampattu, Madhanur, Alangayam and Natrampalli blocks of Vellore district. Physiographically, this district can be broadly classified as hilly terrains and plain regions. The river Palar and its tributaries the Malatar, Guddar and Poiney drain the entire district. The river originates in the highlands of Nandi-durg in the Kolar district of Karnataka (South India) and flows in a south west direction to Vaniyambadi in Tamilnadu. The length of the river is about 295 km in this district. |
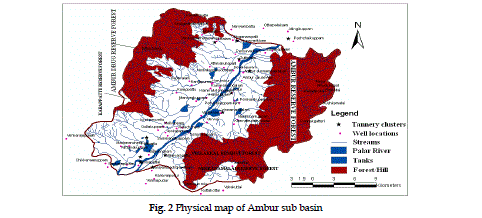
| The river which drains the Ambur sub basin as shown in Figure 2 is Palar. It flows from south west to north east direction taking almost straight course without much meandering. The eastern and western parts of the sub basin is hilly and forest, encompassing with Ambur reserved forest, Vellakal reserved forest, Ambur durg reserved forest and Karappattu reserved forest. The maximum elevation of hill present in the sub basin is 985 m above mean sea level and the minimum being 205 m above mean sea level along Palar river course. The local and regional relief setting gives an idea about the general direction of groundwater flow and its influence on groundwater recharge and discharge. |
Rainfall and Climate
|
| The rain fall analysis is done by analyzing the rainfall data of two appropriate rain gauge stations located in Ambur and Vaniyambadi in this sub basin obtained from Public Works Department (PWD), Tamilnadu. The Ambur sub basin receives rainfall from both southwest and northeast monsoons. The annual normal rainfall (1972-2011) for the sub basin is 735.95 mm, detailed in the chapter 5. The contribution of southwest monsoon ranges from 52 to 57 percent, whereas it ranges from 35 to 36 percent due to northeast monsoon. It enjoys a tropical climate. The highest temperatures are recorded during May and June. The mean daily minimum and maximum temperature are 18.2 to 36.8° C. The relative humidity ranges from 37 to 85 percent (CGWB 2009). |
Polluting Industry
|
| In Vellore District, one of the predominant industrial activities is processing of hides and skins. During the leather tanning process, trade effluent is generated which causes water pollution. The Loss of Ecology Authority in their assessment study stated that the affected agricultural land area is 15164.96 hectares in this district (Source: TNPCB). The number of tannery industries, in Vellore district, under operation is 492 and in addition 109 tanneries are under closure. Total number of Common Effluent Treatment Plants (CETP) is 10. The number of member tanneries of CETP is 395 and the number of individual effluent treatment plants is 97 in this district. Present quantity of effluent disposal from overall CETP in Vellore district into the Palar river is 6945 kl/day, into land application 2105 kl/day and into other water bodies 3200 kl/day (Source: Tamilnadu Pollution Control Board (TNPCB), Tamilnadu, India). |
| The CETP which are functioning in Vaniyambadi, Ambur, Udayendram and Thuthiputtu, are located in Ambur sub basin. There are 166 tannery units linked to these Common Effluent Treatment Plants (CEPT). The number individual effluent treatment plants situated in the study area are 39. These are 7 in Solur, 8 in Thuthiputtu, 2 in Mittalam, 10 in Ambur, 1 in Chinna- varigam, 4 in Valaiyampattu, 3 in Vaniyambadi, 1 in Perumalpet, 2 in Pudur and and 1 in Vinnamangalam . TDS level in the treated effluent from the CETP-Ambur is in the range of 564- 7582 mg/L and from the CETP-Vaniyambadi is in the range of 4500- 18000 mg/L as against the prescribed norms of 2100 mg/L (Source: TNPCB). |
River Water Quality
|
| The water quality of river is severely affected by the disposal of treated as well as untreated tannery effluent for the past several decades. Water Samples were collected from different reaches of river and tested for its quality. |
Groundwater Quality
|
| Groundwater quality of many villages in the sub basin was tested and analysed. |
Field Study
|
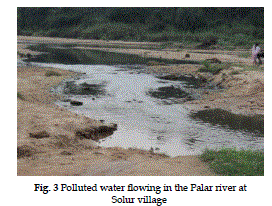
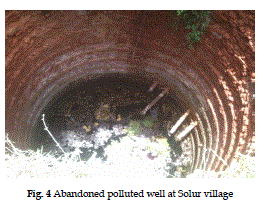
| Initially, GPS survey was conducted for locating the severely affected villages near tannery clusters, near river banks and villages away from tannery clusters and in elevated places. GPS survey was also used to locate tannery industries and polluted sites in the study area. In the sample villages field survey and tests encompassing geophysical survey, pumping test, collection and testing of soil samples, observation of groundwater levels, quality of groundwater and surface water were carried out. The Figures 3 to 7 show the field photos. |
METHODOLOGY
|
| This study encompasses analysis of pollutant migration behavior in groundwater system, simulation of hydro remediation to reduce pollutant load and study of its impact. The methodology of this research is structured into different stages viz. |
| • Detailed micro level field study, survey of farmers, government officials and village administrative officers, field tests for primary data collection from 80 villages which involves collection of groundwater, surface water and soil samples for finding its properties and quality, groundwater levels and location of pollutant sources. |
| • Collection of spatial data and collection of secondary data on agriculture, rainfall, etc., followed by field verification of maps. |
| • Database creation for development of conceptual model using GIS and input to the model |
| • Construction of groundwater flow and contaminant transport model using Visual MODFLOW and calibration of the models and validation. |
| • Simulation of hydro remediation through check dams and finding their impact. |
Groundwater Flow and Transport Modeling
|
| Groundwater flow models (Ala Eldin et al., 2000, Houcyne and Florimond, 2006) are conceptual description of physical systems or processes of sub-surface flow of water into mathematical equations. These equations are used to simulate the actual ground water system, based on different stresses operating in the groundwater domain. Such models are used to represent qualitative and quantitative information of the groundwater system. These models are used to study groundwater flow dynamics, groundwater mass balance so as to manage groundwater resources. These models are also useful in studying the contaminant transport (Gurunadharao & Gupta 1999; Thangarajan 1999; Gurunadharao et al. 2001; Mondal and Singh 2009) in groundwater system, assessing the severity of pollution and taking remedial measures. |
Conceptual Model
|
| Using remote sensing and GIS techniques and based on the detailed micro level field data, the conceptual model of the Ambur sub basin was developed. The conceptual model was used to construct numerical groundwater model of the Ambur sub basin using Visual MODFLOW (McDonald and Harbaugh, 2003), which is based on the finite difference method. This groundwater flow model was used to develop the pollutant transport model for the purpose of predicting the pollutant spread over a future time period. |
Governing Equations of Groundwater Flow and Transport
|
| The governing flow equation (Anderson and Woessner, 1992) for three-dimensional saturated flow in unconfined aquifer is given as: |
 |
| where, |
| Kxx, Kyy, Kzz = hydraulic conductivity along the x,y,z axes which are assumed to be parallel to the major axes of hydraulic conductivity; |
| h = hydraulic head; |
| Q = volumetric flux per unit volume representing source/sink terms; |
| Sy = specific yield defined as the volume of water released from storage per unit change in head per unit volume of porous material. |
| The transport of solutes in the saturated zone is governed by the advection – dispersion equation (Freeze and Cherry, 1979) which for a porous medium with uniform porosity distribution is formulated as follows: |
 |
CONSTRUCT ION OF GROUNDWATER FLOW MODEL
|
Design of Numerical Grid
|
| Groundwater flow model was developed using Visual MODFLOW software. First, the entire study area was divided into rectangular grids or cells since the software solves the flow equation by finite difference method. These cells are block centered and simulated to calculate the groundwater heads. Each cell represents 766m × 624m (0.477 km2) of the study area. Two hydrogeological layers were defined for Ambur sub basin based on data collected from resistivity tests conducted in the field and lithology data. Each layer has 825 cells. The cell thickness was decided based on the lithology, topographic features, slope and resistivity data. In model construction, thickness of each layer was uniformly given such as top soil layer thickness is given as 5m and weathered layer thickness is given as 35m. |
Model Boundary Conditions
|
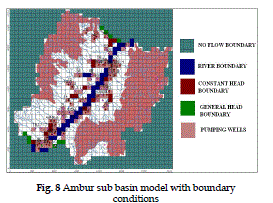
| The sub basin boundary is divided by a ridge line of massive rocks and the flow from these boundaries into the system is negligible and hence they are considered as no flow boundaries. North and South boundaries other than hilly and forest areas were assigned as general head boundaries since these boundaries contribute head to the system from outside the study area. The Palar river enters the system in the south west of the sub basin and leaves the system in the north east of the sub basin and was assigned as the river boundary of the system. Tanks in the system were assigned as constant head boundaries since they act as a constant source for the system in different periods. The Figure 8 shows the Ambur sub basin with boundary conditions. |
Elevation of the Model
|
| Surface elevation of the ground water model was arrived based on the contour map drawn using topo sheets and DEM created in GIS and verified using Digital Elevation Model (DEM) of the study area from ASTER data. Elevations for each layer were recorded with coordinates and placed into separate spreadsheets, then imported as layers in the model. |
Hydrogeological Properties
|
| The aquifer properties, such as hydraulic conduc-tivity and specific yield, given to the model were derived from pumping tests conducted in different villages such as in Bapanapalli, Gollakuppam, Ichchampattu, Melsanankuppam, Nariyampattu, Periyankuppam, Vadacheri, Vadakarai, Virankuppam, Vinnamangalam and Sanankuppam. This data is given for weathered layer of the aquifer system. Hydraulic conductivity given to the top soil layer of the aquifer was derived from permeability tests conducted for soil, collected from different villages in the study area. The specific yield values for top soil layer 0.03-0.3 and for weathered layer 0.01 - 0.03 were based on Groundwater Estimation Methodology - 1997, CGWB. The groundwater level data of the year 2009, monitored from 33 villages has given as input to head observation wells. |
Stress Conditions
|
Groundwater abstraction
|
| The groundwater of the study area is abstracted for irrigation, industrial and domestic purposes. Agriculture is the main activity of the study area. The groundwater draft for irrigation activities is estimated to be 4439.79 ha.m., based on the types of crops cultivated in the study area, crop area and crop of requirement. The groundwater draft for domestic purpose is estimated to be 558.3258 ha.m., based on the number of wells used and number of hours of pumping during monsoon and non monsoon season. The groundwater draft for industrial purpose is estimated to be 235.8 ha.m., based on quantity of effluent discharge from tannery industries. The groundwater draft from the poor groundwater area during monsoon and the non monsoon area is 467.5 and Ham respectively. |
Groundwater recharge
|
| Recharge to the sub-basin was estimated based on Groundwater Estimation Methodology-1997, CGWB and taken as input to the model. Major sources of recharge are rainfall, irrigation return flow, surface water bodies and effluent discharge from tannery industry. The entire sub basin is divided into rechargeable area, hilly and forest area. The rechargeable area is further subdivided into non command area, poor groundwater quality area and tank command area. The results of recharge estimation arrived is given in Table 1. |
Model Calibration and Validation
|
| The steady state flow model was calibrated for January 2009 and validated for January 2010 and transient state flow model was calibrated for the years 2009 and 2010 and validated for 2011. |
CONSTRUCTION OF TRANSPORT MODEL
|
Transport Parameters
|
| Input parameters for transport model were heads calculated from flow model and longitudinal dispersivity calculated based on soil column test conducted in the laboratory. An effective porosity of 0.2 was assumed throughout the study area based on Groundwater Estimation Methodology-1997, CGWB. |
Concentration Observation Wells
|
| A network of 48 concentration observation wells was located in the sample villages for monitoring the TDS concentration. These observation wells were located in and around tannery clusters, near river banks, near tanks and unaffected areas based on field survey. |
Stress Conditions
|
| Contaminant point sources represent the solute concentration in the pumping wells and the designation of recharge concentration represents solute concentration in and around tannery clusters. |
Transport Model Calibration and Validation
|
| The transient state transport model was calibrated for the year 2009 and 2010 and validated for 2011 data. |
SIMULATION SCENARIOS
|
Scenario – 1
|
| In this scenario, simulation of continuous addition of pollution load was given and pollution migration for 30 years (2012 - 2042) was predicted. This is considered as base line scenario. |
Scenario – 2 - Hydro Remediation
|
| In this scenario, hydro remediation through check dams is simulated. The location of check dams are based on CGWB-2007 norms which are as follows: |
| • The total catchment of the check dam should normally be between 40 to 100 Hectares. The rainfall in the catchment should be less than 1000 mm/ annum. |
| • The width of check dam should be at least 5 meters and not exceeding 15 meters and the depth of the bed should not be less than 1 meter. |
| • The catchment area should not be less than 47.7 ha, taking into consideration their distance from the river course. |
| • The soil downstream of the bund should not be prone to water logging. |
| • The lands downstream of check dam should have irrigable land under well irrigation. |
| Hydro remediation through check dams was simulated wherein the recharge capacity of the check dams was planned based on GEC norms and riparian rights of the farmers. The results of baseline scenario and scenario -2 were compared to measure the impact of hydro remediation for 30 year period (2012 – 2042). |
Results and Discussion
|
Pollutant Parameter Used in the Model
|
| The groundwater samples collected from observation wells as shown in Table 2 from 49 villages in the sub basin was analyzed for TDS concentration for the entire study period from 2009-2011 during the pre monsoon and post monsoon. The parameter TDS in mg/L was chosen as the parameter of study for understanding contaminant migration, as this parameter varies phenomenally in the groundwater system. |
Simulation of Groundwater Flow and Transport Model
|
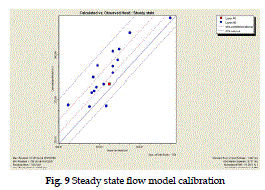
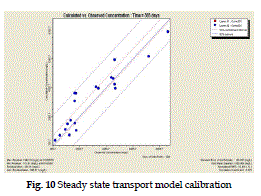
| The steady state flow and transport models were calibrated for Jan 2009 and validated for Jan 2010 and the calibration graphs are given in |
| Figures 9 and 10. The steady state model calibration was carried out to minimize the difference between the computed and field observed ground water level and quality data. The calibration graphs indicate that there is a good agreement between the calculated and observed data. |
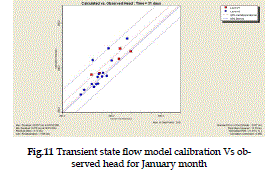
| The transient state flow model was calibrated for the year 2009 monthly data and validated for the year 2010 to 2011 monthly data. The correlation coefficient between calculated and observed heads for the transient state flow model is 0.836 to 0.954. Calibrated graph for the month of Jan 2009 was shown in Figures 11. |
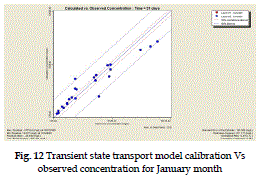
| The transient state transport model was calibrated for the year 2009 monthly data and the correlation coefficient between calculated and observed concentrations for different villages ranges from 0.92 to 0.97. The calibrated graph is shown in Figure 12 for Jan 2009. |
SCENARIO- 1 SIMULATION OF CONTAMINANT MIGRATION WITHOUT ANY REMEDIATION
|
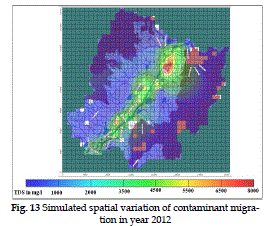
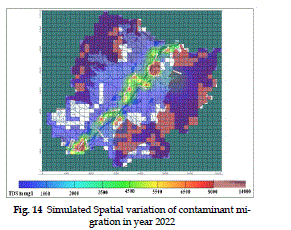
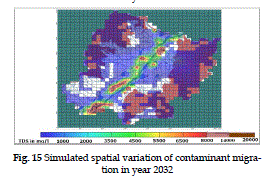
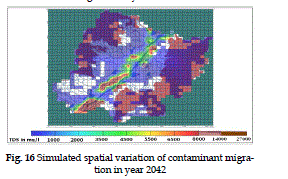
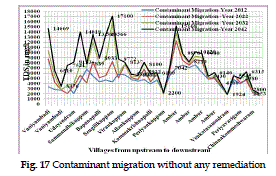
| In this scenario, simulation of continuous addition of pollutant load was given and the contaminant migration for 30 years period (2012 - 2042) was predicted. The spatial variation of TDS concentration for the simulated period 2012, 2022, 2032 and 2042 are shown in Figures 13 to 16. The contaminant concentration (TDS in mg/L) and migration for different periods without any remediation is presented in Figure 17. The simulation results indicate that TDS level in groundwater at different villages increased in varying degrees viz., 10% to 300% and pollution accumulation is taking place in a few villages depen-ding on the contributory factors like distance from pollution sources, hydraulic gradient and hydrogeological properties. The simulation results also indicate that villages in higher elevations remained unaffected by pollution migration. |
| The prediction results indicate that in the villages Vaniyambadi, Vadacheri, Venkatapuram and Ambur, the TDS level increased to nearly 15,000 mg/L after 30 years from 2012 and the percentage increase is between 150% and 300%. In some villages like Udayendram, Bapanapalli, Vadakarai, Virankuppam, and in some places of Ambur and Vaniyambadi, the TDS level increased to around 8000 mg/L and the percentage increase is from 50% to 100%. |
| In a few villages like Sammandhikuppam, Kumaramangalam, Kammakrishnapalli, Thuthipattu and Somalapuram, the percentage increase is from 10% to 20%. All these villages are situated near the banks of the Palar river and affected severely by tannery effluent discharge and tannery clusters. It is observed that the movement of contaminants that occurred with the flow of groundwater with respect to hydraulic gradient and the increase in accumulation of contaminants is due to the lesser dispersion in these villages. |
| In few places of Alankuppam, Sengilikuppam, Maniyarakuppam, Devalapuram and Periyavarigam, it is observed that there is a decrease in TDS level. It may be due to the increase in dispersion which caused the mixing of contaminant with uncontaminated water. |
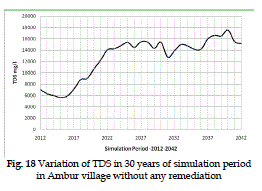
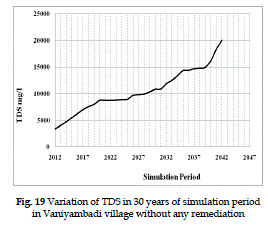
| The trend in contaminant migration for two villages, Ambur and Vaniyambadi, are shown in Figures 18 and 19. Since many tanneries are located in these villages, it shows very high increase in contaminant load. |
SCENARIO- 2 SIMULATION OF HYDRO REMEDIATION
|
| Suitable Site Selection for Artificial Recharge through Check Dams |
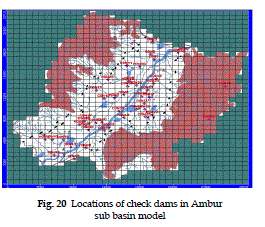
| Using GIS analysis integrated potential and quality map was arrived and it is used for locating suitable sites for check dams with respect to potential and quality. In addition to that the guidelines given for artificial recharge structures, Ministry of Water Resources and GEC-1997 norms are used for check dam location for artificial recharge to increase discharge and dilute the contaminant. The check dam locations in the model are shown in Figure 20. |
Simulation of Hydro Remediation through Check Dams
|
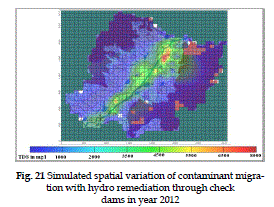
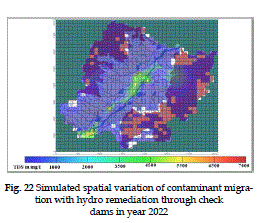
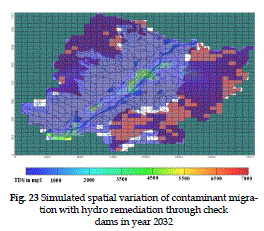
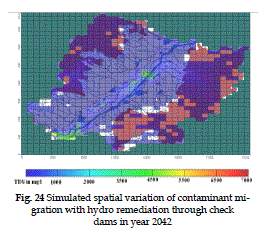
| The recharge through located check dams in the model is simulated in this scenario and the model results are studied. The contaminant migration in the initial simulated year 2012 is shown in Figure 21. The spatial variation of contaminant migration in the years 2022, 2032 and 2042 are shown in Figures 22 to 24 respectively. |
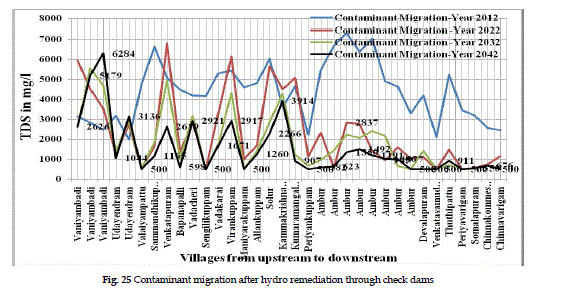
| The trend in contaminant migration for different villages is shown in Figure 25. The results of this simulation indicate that within 20 years, from the initial year 2012, in villages which are located on the right bank of the Palar river of the sub basin the TDS level of groundwater is reduced to the permissible limit (2100 mg/L). This is because the slope towards the Palar river is higher in this location. Except in villages Vaniyambadi, Venkatapuram, Vadakarai, Virankuppam and Kammakrishnapalli, the TDS level have reduced to the permissible limit within 30 years of hydro remediation. |
Conclusion
|
| The groundwater contaminant transport modeling is very useful for predicting the impact of suitable remedial measures for contaminant load reduction in the sub basin. The Ambur sub basin is flanked on eastern and western sides by hills and forest. This facilitates the location of check dams on second and third order streams, in a higher elevation above the contaminated place, thereby enabling effective recharge. This has lead to higher flow velocity in groundwater domain and increased dispersion, resulting in better contaminant dilution. It reveals that hydro remediation through check dams is effective in diluting the contaminant concentration. This approach can be adopted for any sub basin for enhancing artificial recharge. |
Tables at a glance
|
 |
 |
| Table 1 |
Table 2 |
|
| |
Figures at a glance
|
 |
 |
 |
 |
 |
| Figure 1 |
Figure 2 |
Figure 3 |
Figure 4 |
Figure 5 |
|
 |
 |
 |
 |
 |
| Figure 6 |
Figure 7 |
Figure 8 |
Figure 9 |
Figure 10 |
|
 |
 |
 |
 |
 |
| Figure 11 |
Figure 12 |
Figure 13 |
Figure 14 |
Figure 15 |
|
 |
 |
 |
 |
 |
| Figure 16 |
Figure 17 |
Figure 18 |
Figure 19 |
Figure 20 |
|
 |
 |
 |
 |
 |
| Figure 21 |
Figure 22 |
Figure 23 |
Figure 24 |
Figure 25 |
|
| |
References
|
- AlaEldin, M.E.H., Sami Ahmed, M., GurunadhaRao,V.V.S and Dhar, R.L. 2000. Aquifer modeling ofa Ganga-Mahawa sub-basin, a part of the CentralGanga Plain, Uttar Pradesh, India. HydrogeologicalProcesses. 14 : 297-315.
- Anderson, M.P. and Woessner, W.W. 1992. Applied Ground Water Modeling. Academic Press, Newyork.
- Freeze, R.A. and Cherry, J.A. 1979. Ground Water. PrenticeHall, Uper Saddle River, N.J.
- GEC-1997. Groundwater Estimation Committee Report,Central Ground Water Board, Ministry of Water
- Resources, Government of India, April 1998.
- Gurunadharao, V.V.S. and Gupta, S.K. 2000. Mass Transportmodeling to assess contamination of water supplywell in Sabarmathi river bed aquifer, Ahmedabadcity, India. Environmental Geology. 39 (8) : 893- 900.
- Gurunadha Rao, V.V.S, Dhar, R.L and Subrahmanyam, K. 2001. Assessment of contaminant migration ingroundwater from an industrial area, Medak District,Andhra Pradesh, India. Water, Air and Soil Pollution.128 : 369-389.
- Heyddy Calderon Palma and Laurence R. Bentley, 2007.A Regional-Scale groundwater flow model for theLeon-Chinandega aquifer, Nicaragua. HydrogelogyJournal. 15 : 1457-1472.
- Houcyne, E.l. Idrysy and Florimond De Smedt, 2006. Modellinggroundwater flow of Trifa aquifer, Morocco.Hydrogeology Journal. 14 : 1265-1276.
- Mondal, N.C. and Singh, V.S. 2009. Mass transport modelingof an industrial belt using Visual MODFLOW
- and MODPATH: A case study. Journal of Geography & Regional Planning. 2 (1) : 001-019.
- Thangarajan, M. 1999. Modelling pollutant migration inthe upper Palar river Basin, Tamil Nadu, India. EnvironmentalGeology. 38 (3) : 209-222
|