Keywords
|
| Inverse fluidized bed reactor, Kinetic Modeling, First Order model. |
INTRODUCTION
|
| During the last few years, the application of fluidization in the field of biotechnology has increased considerably (Fan et al. 1989). The main application of fluidization principle is in the field of environmental biotechnology (Schugerl, 1989). Fluidized bed bioreactor has several advantages over other conventional reactors for the treatment of wastewater (Sokol, 2001). The inverse fluidization is a multiphase gas-liquid-solid system. The difference between ordinary fluidization and inverse fluidization lies in the density of solid particles used in the reactor. If the density of the particles used is greater than the fluid, it is ordinary fluidization; if it is less than fluid it is called as inverse fluidization. Inverse fluidization has all the advantages of ordinary fluidization. In addition, the use of low-density particles has some advantages and overcomes the problem, which occurs during conventional fluidization. Low-density particles require low fluid velocity for their expansion and hence low power requirement. Inverse Fluidized Bed Bio Reactor IFBBR, the control of biofilm thickness is achieved within a narrow range (Karamanev, 1987). The particle-particle and particle wall collision maintains a constant biofilm thickness (Sokol, 2001). |
| Biological treatment processes have been successfully described by the theory of continuous cultivation of microorganisms and process kinetics have been used for the mathematical description of aerobic biological degradation (Karthikeyan, 2001). In this work, data obtained from the continuous degradation of starch wastewater in an inverse fluidized bed reactor were fitted to various biokinetic models. The model, which represents the continuous study, was identified. |
The First Order Model
|
 |
The Diffusional Model
|
| Suidan et al. (1987) demonstrated that substrate utilization kinetics within biofilm can accurately be described by a model including reaction with diffusion and four different situations may occur i) The biofilm is deep and the surface substrate concentration is very low; in this case the fermentation takes place following pseudo-first order kinetics not depending on the biofilm thickness. ii) The biofilm is deep and the surface substrate concentration is very high and approaching that in the bulk; the fermentation rate variation with the square root of substrate concentration is typical of a diffusion-limited zero order reaction : |
 |
| iii) The biofilm is fully penetrated and the surface substrate concentration is very low; once again, pseudo first order kinetics would be consistent with the process but the fermentation rate would depend on biofilm thickness. |
| iv) The biofilm is fully penetrated and the surface substrate concentration is very high and approaching that of the bulk; in this case the fermentation rate should follow zero order kinetics. |
 |
The Singh Model
|
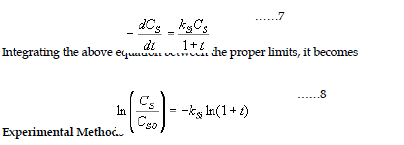
| A modified version of the first order kinetic model was proposed by Singh et al. (1983). During degradation, the rate could vary according to the nature of the substrate under consideration, which changes both qualitatively and quantitatively as the digestion process proceeds with time. This necessitates the incorporation of time function to control the kinetic constant. |
The Singh Model is given by
|
 |
Experimental Methods
|
| The starch industry wastewater obtained from the industry was characterized. Experiments were carried out in an inverse fluidized bed bioreactor with low density supporting particles. The supporting particles used in this study were made of polypropylene with a density of 870 kg/m3. It is irregular in shape with an average diameter of 10 mm and surface area of 390mm2/mm3. The wastewater was treated in an IFBBR at various initial substrate concentrations (2250, 4475, 6730 and 8910 mg COD/L) for different hydraulic retention time (40, 32, 24, 16 and 8h). Experiments were carried out at an optimum bed height of 80 cm and an airflow rate of 62.50 cc/s (Rajasimman and Karthikeyan, 2006). The pH of the wastewater was maintained at 6.0. The data obtained from the continuous degradation was used to fit the various kinetic models. |
RESULTS AND DISCUSSION
|
| The biodegradation kinetics was studied for the continuous degradation of starch wastewater at different initial substrate concentration and various hydraulic retention time. The experimental data obtained from IFBBR were fitted to the First order, Diffusional and Singh kinetic models. |
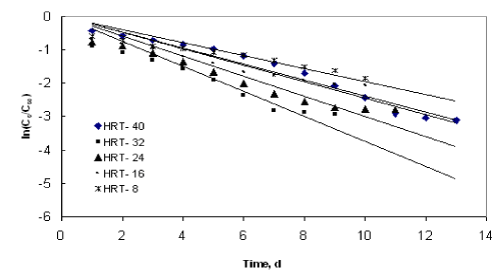
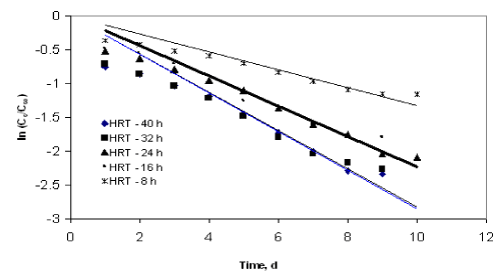
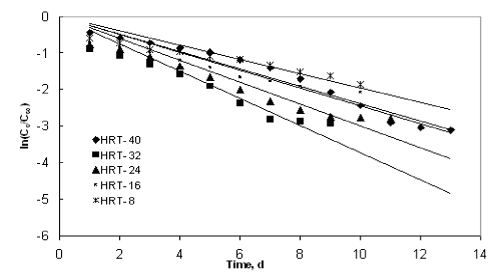
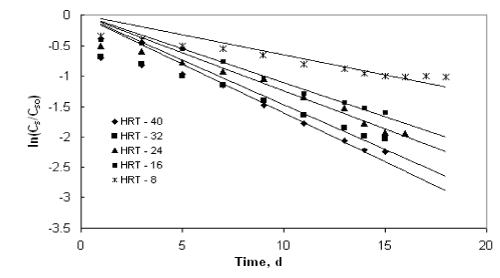
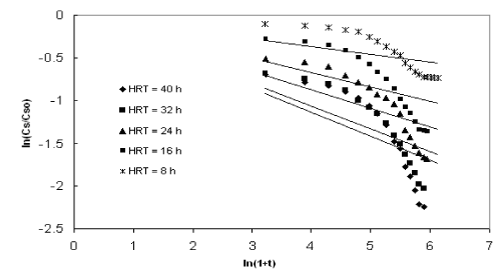
| The application of the first order model to the COD reduction at different initial substrate concentration was shown in Figures 1 to 4. The values of the kinetic parameter present in the continuous model for all initial substrate concentrations were estimated from the slope of the best-fit lines and it was given in Table 1. The values of the rate constant and higher values of R2 (>0.90) prove the ability of this model in describing the degradation kinetics of starch industry wastewater in an inverse fluidized bed bioreactor. As the initial substrate concentration increases, the first order rate constant decreases and this can be ascribed to a growing importance of the recalcitrant fraction in reducing the diffusivity of biodegradable substance. In addition, high valuesof R2 obtained with the first order model makes the model more valid in representing the continuous degradation of starch wastewater. |
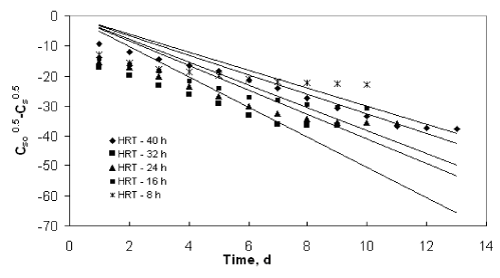
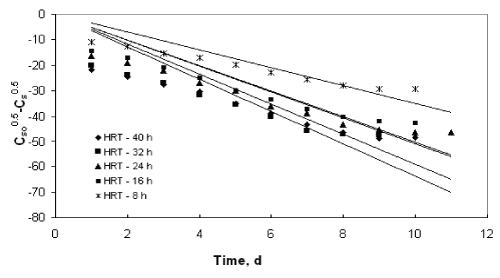
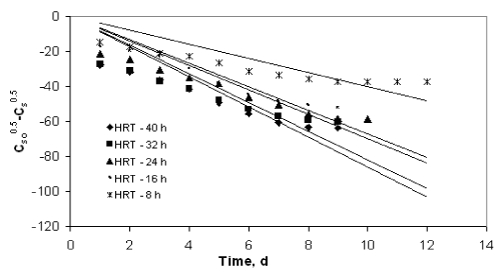
| The experimental data obtained from the inverse fluidized bed reactor were represented by the Diffusional model in Figure 5 to Figure 8. The kinetic rate constants and R2 values obtained from graph were shown in Table 2. The biodegradation rate does not depend on diffusion phenomenon. Hence, Diffusional model failed miserably in representing the continuous biodegradation of starch wastewater in IFBBR. This fact is also complimented by the poor values of R2 obtained with the half order model. |
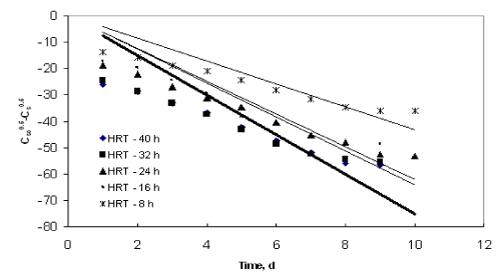
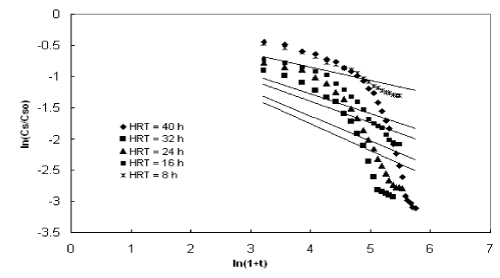
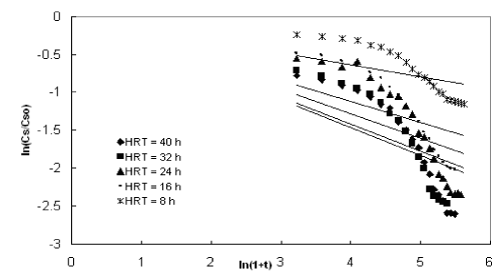
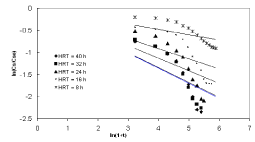
| Figures 9 to 12 shows the data obtained from IFBBR represented by the Singh model. The rate constant and R2 values were obtained from the best-fit lines and it was presented in Table 3. Even though the values of rate constant decreases with increase in concentration the R2 values were found to be low. Hence the Singh model fails to describe the continuous degradation of starch industry wastewater in the present study. |
CONCLUSION
|
| In the present study, three bio kinetic models namely First order, Diffusional and Singh model were applied to the data obtained from an Inverse Fluidized Bed bioreactor treating starch industry wastewater. From the results it was observed that the First order model fits the data well with high R2 values, whereas the other two models fails to explain the present degradation study. |
Nomenclature
|
| CSO – Initial substrate concentration, mg COD/L |
| CS – Substrate concentration, mg COD/L |
| t – Degradation time, h |
| kI – First Order rate constant, h-1 |
| kD – Rate constant for Diffusional model, mg COD 0.5/L0.5h |
| kSI – Rate constant for Singh Model, h-1 |
Tables at a glance
|
|
|
| |
Figures at a glance
|
 |
 |
 |
 |
 |
| Figure 1 |
Figure 2 |
Figure 3 |
Figure 4 |
Figure 5 |
 |
 |
 |
 |
 |
| Figure 6 |
Figure 7 |
Figure 8 |
Figure 9 |
Figure 10 |
 |
 |
| Figure 11 |
Figure 12 |
|
| |
References
|
- Fan, L.S. and Tang, W.T. 1989. Hydrodynamics of a three phase fluidized bed containing low-density particles. AIChE Journal. 35 (3) : 355-364.
- Karamanev, L. and Nikolov, L. 1987. Experimental study of the Inverse fluidized bed biofilm reactor. Canadian Journal of Chemical Engineering. 65 : 214-217 .
- Karthikeyan, C. 2001. Cassava starch wastewater treatment in batch and UASB reactors. Ph.D Thesis, Annamalai University.
- Pfeffer, J.T. 1974. Biotechnol.Bioengg. 26 : 771-776.
- Rajasimman, M. and Karthikeyan, C. 2006. Treatment of starch industry effluent in an inverse fluidized bed bioreactor. Journal Applied Sciences and Environmental Management. 10 (1) : 39-44.
- Schugerl, K. 1989. Biofluidization : Application of the fluidization technique in Biotechnology. Canadian Journal of Chemical Engineering. 67 : 178-184.
- Singh, R., Jain, M.K. and Tauro, P. 1983. Water Res. 17 : 349 -354.
- Sokol, W. 2001. Operating parameters for a gas-liquid-solid fluidized bed bioreactor with a low-density biomass support. Biochemical Engineering Journal. 8 : 203-212.
- Suidan, M.T., Ritman, M.T. and Traegner, U.K.. 1987. Water Res. 21 : 491-498.
|