
ISSN (0970-2083)
ISSN (0970-2083)
Aleksander Vladimirovich Bogdan *, Aleksander Nikolaevich Sobol, Olegvladimirovich Grigorash, Robert Aleksandrovich Amerkhanov And Adimir Valentinovich Tropin
Kuban State Agrarian University, 350044, Krasnodar, Kalinina Street, 13, Russia
Received Date: 06 April, 2017; Accepted Date: 08 April, 2017
Visit for more related articles at Journal of Industrial Pollution Control
When self-excited induction generator stator windings become faulty, there is a specific range of faulty turns within which the generator does not lose excitation and continues to operate with high current in winding turns. This may cause faults of the generator and the entire unit, since it is believed that the generator loses excitation in case of short circuit (SC), and the fault current stops. Obtaining the analytical dependency of faulty induction generator currents on the SC point location within the stator winding is related to a high number of factors and is complicated by the non-linearity of some characteristics. Applying the methods of the experimental design theory makes it possible to obtain algebraic expressions in the form that is adapted as much as possible to solve this task.
Experimental design theory, Turn-to-turn short-circuits in stator winding, Self-excited induction generator
Self-excited generators with capacitive self-excitation (AG) are applied in wind power generators, as generators of mini hydro power plants, etc. Theoretical studies and practical experience prove the perspectives of applying them in agriculture, as well as a backup power supply for animal production units and poultry farms (Gashimov and Abdulzade, 2004). It is known that in most cases (85% to 95%), failures of asynchronous machines are associated with faults of the stator winding. More than 90% of faults represent turn-to-turn short circuits (Dzhendubayev, 2002; Toroptsev, 2004). Shortcircuiting of a small number of AG stator winding turns cannot significantly change the primary magnetic flux of the machine, so it is very likely that an AG can operate for a long period with such a failure (Kumawat, et al., 2015). A dormant failure in the form of a turn-to-turn short-circuit significantly reduces the fail-safety of a self-excited AG as a power source (Bogdan and Sobol, 2013).
Obtaining the analytical dependency of faulty induction generator currents on the SC point location within the stator winding is related to a high number of factors and is complicated by the non-linearity of some characteristics. However, applying the methods of the experimental design theory makes it possible to obtain algebraic expressions in the form that is adapted as much as possible to solve this task (Bogdan, et al., 2007).
General approaches to solving the task
For the experiment, an AG unit was prepared, based on an asynchronous electrical motor with a 4A100S4U3 squirrel-cage rotor (3 kW, 1435 rpm) (Jain, et al., 2002). The generator was driven by a DC motor (AG drive with soft speed-torque characteristic) or by an asynchronous motor (AG drive with rigid speed-torque characteristic). The power capacity of driven motors was comparable to that of the AG. Generator voltage during SC was maintained at 220 V (Grigorash, 2002).
The dependency curve between the SC current (A) as related to the rated current and the number of SC turns W, %, for an AG drive with soft speed-torque characteristic is shown in Figure 1.

Figure 1: SC current dependency on the number of short-circuited turns
During a multiple-factor experiment (Adler, et al., 1976; Adler, et al., 1982), three factors were selected, having a substantial impact on the process:
��? Factor X1 -number of turns in the faulty phase(s), starting with neutral terminals, %;
â�?�? Factor X2 -self-excitation circuit capacitance (μF);
��? Factor X3 -generator circuit active load (W/phase).
Of practical interest for the study is to determine the correlation dependency between the above factors. A complete factorial experiment 23 was done. The curve section, for which the experimental design test was done, such as for the SC current in Figure 1, is located between the points A and B. For all other values, the same section was used, since they have similar dependency. The upper and the lower levels, along with variability intervals for experiments with turn-to-turn short-circuits, are given in Table 1.
| Factors | Levels of factors | Variability intervals | |
|---|---|---|---|
| -1 | +1 | ||
| X1 | 3 | 15 | 6 |
| X2 | 28 | 40 | 6 |
| X3 | 100 | 300 | 100 |
Table 1: Levels of factors and variability intervals
Beta coefficients were calculated taking into account the homogeneity of variance under the Kohren criteria, and the model adequacy was checked under F (Fischer) criterion. As a results, regression equations were obtained, taking into account the relevance of coefficients for stabilized values of phase (I), capacitive (I CAP), load currents (I LD), SC currents (I SC) and phase voltages (U). The coefficients of the interaction of the factors were not considered in this article.
Calculation example
A The methodology of applying the experimental design theory will be considered with the calculation example for the SC current in case of a "rigid" system (for asynchronous motor-driven generators). For this purpose, let us calculate the coefficients of regression equations; the design matrix is given in Table 2.
| Design point number | Coded designations of factors | Coded designations of combinations of products | Actual response values upon the results of parallel experiments | Average response value | |||||||
|---|---|---|---|---|---|---|---|---|---|---|---|
| X0 | X2 | X2 | X1X2 | X1X2 | X1X3 | X2X3 | Y1 | Y2 | Y3 | Yav | |
| 1 | + | + | + | + | + | + | + | 55 | 54.4 | 53.8 | 53.8 |
| 2 | + | - | - | + | + | - | - | 57.28 | 57.32 | 56 | 56.867 |
| 3 | + | - | + | - | - | + | - | 54 | 55.2 | 55.4 | 54.867 |
| 4 | + | + | - | + | - | + | + | 57 | 57 | 58 | 57.333 |
| 5 | + | + | + | - | + | - | - | 36.8 | 35 | 36 | 35.933 |
| 6 | + | - | + | + | - | - | + | 61 | 59 | 61 | 60.333 |
| 7 | + | + | - | - | - | - | - | 41.4 | 40.88 | 42 | 41.427 |
| 8 | + | - | - | - | + | + | + | 52 | 55.08 | 54 | 53.693 |
Table 2: Experimental design matrix for SC current
For variable factors, the coefficients will be equal to:
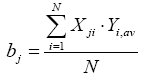 (1)
(1)
Where j = 0, 1, 2, …, k is the factor number, i = 0, 1, 2, …, N is the design line number.
In this manner, the coefficient value is obtained as an average of the sum of responses of each design line where each response is assigned with a sign from the column of the factor for which the coefficient is calculated. The levels of factors and variability intervals are given in Table 3.
| Factors | Levels of factors | Variability intervals | |
|---|---|---|---|
| -1 | +1 | ||
| X1 | 3 | 15 | 6 |
| X2 | 30 | 70 | 20 |
| X3 | 0.2 | 0.5 | 0.15 |
Table 3: Levels of factors and variability interval
For the interaction of factors, the coefficients will be equal to:
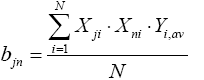 (2)
(2)
Where j and n = 0, 1, 2, …, k is the number of an interacting factor.

Other coefficients are calculated similarly, and the regression equation will look as follows:

To assess the response deviations from the average value, we should calculate the repeatability dispersions according to the results of n parallel observations of the experimental design matrix in each point by using the following formula:
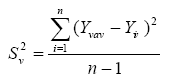 (4)
(4)
Where S2ν is the dispersion in the v-th point; i is the sequential number of the parallel experiment in this design point; Yvav is the mean arithmetic of the response in m parallel experiment in point ν; Yvi is the response value in the v-th point.
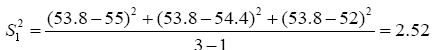
Similarly, other dispersions are calculated. The sum of dispersions will be as follows:

Now, having the maximum dispersion S2vmax we find the Kohren calculation criterion:
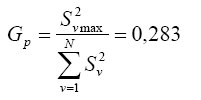 (4)
(4)
The number of the degrees of freedom for lines f1=3-1=2. For columns f2=8. The tabular value of the criterion Gcr=0.516. Since 0.283 ≤ 0.516, the Kohren criterion is met.
Now let us check the relevance of the regression equation coefficients under the Student criterion:
 (5)
(5)
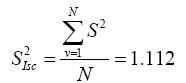
The dispersion of the regression coefficient calculation error is found. For the equal number of parallel experiments n in all points of the matrix design, regression coefficient calculation errors are calculated using the following formula:
 (6)
(6)
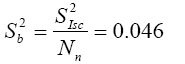
Now let us find the root-mean-square dispersion deviation for the regression coefficient calculation error:
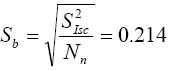 (7)
(7)
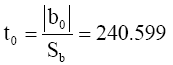
Now let us check the relevance of regression coefficients under the Student t-criterion: For each coefficient, we calculate the value of the tj -criterion:
 (8)
(8)
Where tj is the Student criteria;  is the modulus of the calculated regression criterion.
Other values are calculated in a similar fashion.
The number of degrees of freedom fc=N(n-1)=16. Fischer criterion's tabular value tcr=2.12
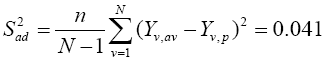
To check the model adequacy under the mathematical model (regression equation), the response value Yv,p is calculated for each matrix design line, e.g., with respect to the factor sign, the design includes an algebraic sum of equation coefficients. Now we calculate the difference between the average Yv,av and rated Yv,p response values in each line. This difference is squared and the results obtained are summed up.
The adequacy dispersion is assessed using the formula:
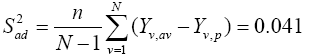 (9)
(9)
Where l is the number of relevant coefficients (including b0).
The model adequacy is checked under the Fischer criterion:
 (10)
(10)
where F is the Fischer criterion; S2ad is the assessment of adequacy dispersion.
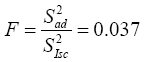
The number of degrees of freedom for lines ff2=N(n-1)=16 and for columns ff1=N-17=7. Fischer's tabular value Fcr=11.665. 11.665 > 0.037 and the condition is met.
When the AG is driven by a drive with soft speedtorque characteristic, Index 1 is used, and when the AG drive has a rigid speed-torque characteristic, Index 2 is used.
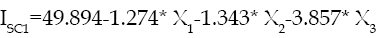
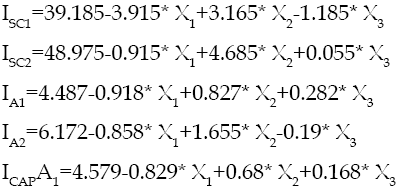
As a result of experimental data processing during turn-to-turn short-circuits in the winding of a single phase, the equations for a faulty phase A were obtained as follows:
-stator phase currents


- capacitance currents


- loading currents
 (11)
(11)
 10
10
- currents in short-circuited turns

- voltages on asynchronous generator terminals


These dependencies show that for the increased number of short-circuited turns, the phase current, the SC current and all other currents go down. For a soft speed-torque characteristic, the current in the faulty phase increases with the load. For an AG drive with rigid speed-torque characteristic, the loading increase causes the current of the faulty phase to decrease. When the self-excitation capacitance increases, so does the phase current. The capacitance current and the phase voltage change in a similar way. Loading current equations have the same nature, the SC current in an AG drive with rigid speed-torque characteristic increases together with the self-excitation capacitance unlike the AG drive with soft speed-torque characteristic.
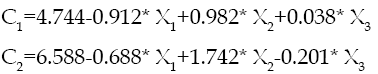
The current dependences in steady conditions for non-faulty phases have the same nature. For example, for the phase B, the regression equations with respect to coefficient will be as follows:


 (12)
(12)


The experiments were also done for phase-to-phase short circuits. It was understood that in case of symmetrical two-phase short-circuits, the factor of X1 is the number of turns in faulty phases, and in case of asymmetric short-circuits, this is the total number of turns in faulty phases.
For symmetric two-phase short-circuits, the number of short-circuits turns in the phases A and B was taken as 3% and 10% for two levels, respectively. For non-symmetrical short-circuits in the lower level, the number of short-circuits turns in the phase A was taken as 1%, that for the phase B as 3%. For the upper level, the number of short-circuits turns in the phase A was taken as 3%, that for the phase B as 15%.
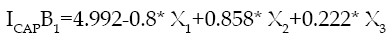
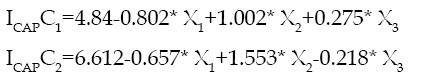
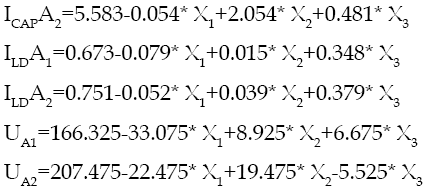
Regression equations for SC currents, phase currents and loading currents for non-symmetrical phase-tophase short-circuits for one of the damaged phases (phase A) are as follows:
 (13)
(13)
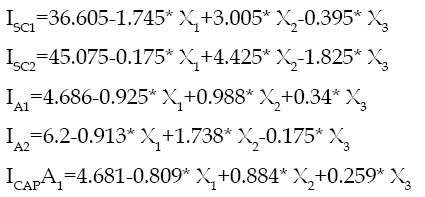
For a non-faulty phase C, regression equations for phase and capacitive currents will be as follows:
 (14)
(14)
Equations for loading currents and phase voltages will be as follows:
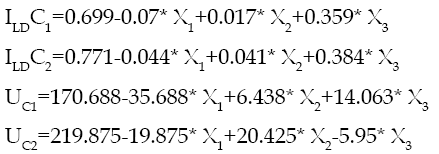 (15)
(15)
These equations show that in both phase-to-phase and turn-to-turn short-circuits, for an AG drive with soft speed-torque characteristic, the loading increase causes phase currents to be increased, and for an AG drive with rigid speed-torque characteristic, it causes them to go down. SC currents in both cases increase when the self-excitation capacitance does. Loading currents behave the same in both cases.
For symmetric phase-to-phase SC, these regression equations for phase A look as follows:
 (16)
(16)
Unlike phase-to-phase asymmetric and turn-to-turn short-circuits, the capacitance current for both types of the generator drives increases along with the load. When the generator load is increased, so is the SC current.
Applying the experimental design theory allowed analyzing the impact of various factors onto primary parameters of the asynchronous generator by using algebraic expression in a convenient-to-use form, which allows studying phenomena occurring within the machine.
It has been established that when the loading increases, the current in the faulty phase falls down. When the self-excitation capacitance increases, so do the currents in the faulty phase. With the increased number of SC turns, the currents in the phase fall down. Capacitance current and phase voltage change in a similar way.
Current dependences in steady conditions for nonfaulty phases have the same nature. The SC current value depends on the generator drive speed-torque characteristic. The SC current in an AG drive with rigid speed-torque characteristic increases together with the self-excitation capacitance unlike the AG drive with soft speed-torque characteristic.
Copyright © 2024 Research and Reviews, All Rights Reserved