
ISSN (0970-2083)
ISSN (0970-2083)
Andrey Mikhailovich Ivanov, Vitaliy Valentinovich Gaevskiy, Sergey Robertovich Kristalniy, Nikolay Viktorovich Popov, Sergey Sergeevich Shadrin* and Vladimir Aleksandrovich Fomichev
Moscow Automobile and Road Construction State Technical University (MADI) 125319, Leningradsky Prosp 64, Moscow, Russia
Received 29 May, 2017; Accepted 04 June, 2017
Visit for more related articles at Journal of Industrial Pollution Control
The paper proposes a method for determining the longitudinal coefficient of adhesion of a studded tire on road surface, depending on the relative slip of the wheel (the φ-S diagram). The method for determining the coefficient is based on the analysis of vehicle deceleration and the relative slip of its braking wheels. The advantages and disadvantages of the developed method are indicated. Tests of the adhesion properties on ice of winter studded and non-studded tires were carried out according to the developed method. The tests were a series of braking the car Ford Focus with rear axle brakes. A set of measuring and recording equipment necessary for testing is described, and the test results are shown. The displacement of the φ-S diagram maximum of the studded tire to the area of large relative slip is determined. It was suggested that the effectiveness of electronic active safety systems can be reduced when the tire tread is studded.
Car tests, Wheel movement on snow, Wheel movement on ice, Adhesion coefficient, Anti-lock system, Electronic stability control, Studded tires, Pneumatic tire slip
Dependences of the tire adhesion coefficients for various road surfaces with respect to the values of longitudinal slip are usually called as the φ–S diagrams. These diagrams are very important in the development of algorithms for the functioning of anti-lock braking systems (ABS), electronic stability control (ESC), as well as a number of other systems affecting braking systems of a vehicle. The types of φ–S diagrams for non-studded tires on different road surfaces are well known and are shown in Fig. 1 (Kristalnyy, et al., 2012; Kiencke and Nielsen, 2005; Reimpell and Sponagel, 1995; Lu, 1994; Svendenius, 2007; Ahn, 2011).

Fig. 1 φ-S diagrams for non-studded tires on different road surfaces.
At the same time, the adhesion properties of the studded tires have not been sufficiently investigated (Scheibe, 2002; Fridstrom, 2001). There are reasons to believe that the operation of the studded tire on ice will lead to a significant difference between its φ–S diagram from the φ–S diagram of the non-studded tire. This is due to the fact that for the tire the ice is a hard coat, and for the anti-slip studs such surface is deformable. On deformable soils, the φ–S maximum is achieved at 100% of relative slip. Consequently, the adhesion coefficient maximum in the longitudinal direction should shift to the area of large slips. This circumstance may lead to a decrease in the effectiveness of the electronic active safety systems when mounting studded tires on the car. The study of these issues is topical, since the probability of the operation of the electronic safety systems is greater on road surfaces with poor friction.
The determination of the adhesion characteristics on a special roller tester with a freezing layer of ice is not possible due to the formation of ice crumbs on the roller surface, which prevents obtaining stable characteristics (Tire Tests on a Roller Stand on a Polymer-Concrete Coating and Ice, n.d.).
To determine the adhesion properties of studded tires on ice, the Automobile Department of Moscow Automobile and Road Construction State Technical University in cooperation with the Testing center of Central research and development automobile and engine institute (NAMI) developed a method for experimental research.
The method for determining the adhesion properties of tires is based on the method of determining the longitudinal coefficient of adhesion to determine the adhesion force that is realized when testing ABS in accordance with Annex 6 of UNECE Regulation No. 13H (Economic Commission for Europe of the United Nations, 2010). This method was further developed by introducing the possibility of analyzing the slip of the wheels during braking.
To identify the longitudinal adhesion coefficient of the tire to the road surface, a passenger car was used that had passed a special preparation.
That preparation included the following steps:
1. Provision of braking with only one axle (i.e., it was possible to disengage the brakes of one axle while maintaining the braking performance of the other axle);
2. Installation of measuring and recording equipment for determining the vehicle speed, longitudinal acceleration (deceleration), wheel angular velocity, brake pedal force.
The change in the slip of the wheels of the braked axle was provided by the working braking system of the car, acting on the braking mechanisms of the braked axle.
When braking with one axle, the longitudinal adhesion coefficient of φx is determined by the ratio of the longitudinal braking force Rx in the contact area of the braked wheels to the dynamic vertical load on this axle Rzdyn:
 (1)
(1)
The braking force Rx is calculated based on the deceleration of the vehicle, taking into account the rolling resistance of the unbreaking axle. The dynamic vertical load Rzdyn on the braking axle is calculated based on the preloading or unloading of it during braking.
To determine the conditions for critical slip of the wheels of the braking axle, sections with the same slip of both braking wheels are considered, and the attained deceleration jd is analyzed.'
During the tests, the value of jd can be determined for any period of the time tper, during which the slip of the wheels of the braking axle is the same, according to the formula:
 (2)
(2)
Where Vc1 and Vc2 is the speed of the car, respectively at the beginning and at the end of the interval of motion with the same slip of the wheels.
The slip of the wheels S is determined by the following formula:
 (3)
(3)
where Vc is the speed of the car;
Vwh is the circumferential velocity of the braking wheel (Vwh=ωwhÃŽÃâ¡rwh, where ωwh is the angular velocity of the wheel, rwh is the kinematic radius of the wheel).
Thus, the adhesion coefficient is calculated by the formulas:
In the case of braking the front axle,
 (4)
(4)
In the case of braking the rear axle
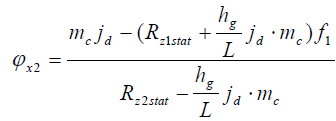 (5)
(5)
where
mc is the car weight, kg;
jd is the car deceleration, m/s2;
f1 is a coefficient of rolling resistance of the front wheels;
f2 is a coefficient of rolling resistance of the rear wheels;
Rz1stat is vertical reaction of the road surface to the wheels of the front axle under static conditions, N;
Rz2stat is vertical reaction of the road surface to the wheels of the rear axle under static conditions, N;
hg is height of the center of mass, mm;
L is a wheelbase, mm.
Taking into account the greater friction losses in the driving axle, in comparison with the driven axle on the basis of UNECE Regulation No. 13H (Economic Commission for Europe of the United Nations, 2010), we take the rolling resistance coefficients of the wheels f1 and f2 equal to 0.015 for the driving axis and 0.010 for the driven axis.
In detail, the test technology for determining φx is described in (Economic Commission for Europe of the United Nations, 2010).
Using formulas (4) and (5), according to the analysis of test run sections with the same slip of the right and left wheels, the data of the adhesion coefficients and relative slip values can be obtained. These data will make it possible to construct the dependence of the adhesion coefficients in the longitudinal direction with respect to the relative slip (the φ–S diagram).
Description of the tests performed
According to the developed method, comparative tests of the adhesion properties of winter studded and non-studded tires were carried out on ice and their φ–S diagrams were determined.
For the tests, two sets of winter tires Yokohama iceGUARD Stud IG35 (dimension 185/70 R14 92T) (Fig. 2) were used.

Fig. 2 Winter tire Yokohama iceGUARD Stud IG35: i) studded; ii) non-studded.
Both sets have the same design, rubber composition, tread pattern and serial number, and differ from each other only by the absence or presence of antislip studs. This allows avoiding other factors in determining the degree of influence of the anti-slip studs on the overall process of interaction of tires with the supporting surface.
The tests were carried out on a FORD Focus I frontwheel- drive car (Fig. 3), provided by the Testing center of NAMI.

Fig. 3 Test vehicle ford focus I.
The following measuring and recording equipment was installed on the car:
− Peiseler GmbH DB-PRINT measuring system (fifth wheel) for the vehicle acceleration and deceleration testing;
− BALLUFF BDG 6360 remote sensors for angular velocity (rotation speed) of the wheel;
− CORRSYSâÃâ¬ÃâDATRON CPFTA brake pedal force sensor;
− Compact CORRSYSâÃâ¬ÃâDATRON DASâÃâ¬Ãâ3 mobile data acquisition and processing system.
The BDG 6360 remote sensors were installed on each wheel of the car. The compact CORRSYSâÃâ¬ÃâDATRON DAS-3 mobile data acquisition and processing system provided synchronized recording and processing of the registered parameters.
The power supply of the measuring and recording equipment was carried out from the vehicle electrical system. To distribute and stabilize the power supply, the power distribution unit Small 12V Power Distributor Box by CORRSYS-DATRON, Germany, was installed on the car.
The installation layout of the testing and recording equipment is shown in Fig. 4.

Fig. 4 The layout of measuring and recording equipment.
To obtain φ–S diagrams of winter studded and nonstudded tires, a series of test runs on ice was carried out. The test maneuver was taken from UNECE Regulation No. 13H: braking from an initial speed of 50 km/h to 0 km/h with the rear axle (front brakes disabled) without ABS with a gradual increase in pressure in the brake line. It was decided to carry out the test runs with only braking the rear axle and, accordingly, to determine the φ–S diagrams on the rear axle, as this ensured the minimization of errors introduced by the drive components of the driving wheels.
To ensure that, only the rear axle of the vehicle is braked, the brake hoses of the front brakes were clamped with special clamps. The ABS was turned off by removing the electrical fuses.
The ice was frozen on a straight horizontal section to evaluate the braking properties of cars. The stability of the results was ensured by the careful observance of the identity of the test conditions: ambient air temperature and ice did not differ by more than 0.5°C from run to run; the ice and atmosphere conditions were identical for the entire duration of the test runs (Tables 1 and 2). The total weight of the car included the weight of the equipped vehicle, the expert, the ballast and the test equipment. The car was ballasted with 75 kg in order to achieve an even distribution of loads along the sides to balance the driver's weight. The amount of fuel in the tank was maintained in the range 25 ... 30 liters. The pressure in the tires was set at a nominal value of 0.22 MPa. The height of the center of mass was determined by the method of the Testing center of NAMI.
| Air Temperature | -9.2°C to 9.7°C |
| Ice Temperature | -7.6°C to 8.1 °C |
| Ice Condition | Unsharp, clean |
| Atmosphere Condition | No precipitation, sunny weather |
Note: Weight and geometric characteristics of the test car are presented in Table 2.
Table 1. Test conditions
| Weight on the front axle, kg | 822.5 |
| Weight on the rear axle, kg | 551 |
| Total weight, kg | 1373.5 |
| Wheelbase, mm | 2615 |
| Mass center height, mm | 545 |
Table 2. Test car characteristics
A total of 106 test runs were carried out on both sets of tires to one and the back direction on the test road.
During the tests, the following parameters of the vehicle's movement were constantly recorded:
− The vehicle velocity;
− The angular velocities of wheels;
− The vehicle acceleration;
− The brake pedal force.
The records of the parameters of the vehicle's movement in a graphic form during a typical run by determining the adhesion coefficient are shown in Fig. 5. The graphs show the circumferential speeds of each wheel, the speed of the car according to the "fifth wheel" and the force of pressing the brake pedal. Also, Fig. 5 shows the graphs of the change in the relative slip of the braked wheels, calculated from formula (3).

Fig. 5 Determination of the longitudinal friction coefficient Conventions: 5 wheel-car speed according to the sensor of the "fifth wheel" type system FL, FR, RL, RR are rim speed and slipping of the front left, front right, rear left and rear right wheels respectively; BRAKE is the brake pedal force.
To determine the dependence of the deceleration jd of the vehicle with respect to the relative slip, we have chosen sections with the same relative slip of both braking wheels (Fig. 5).
The deceleration jd for the selected interval was determined by formula (2).
For each calculated deceleration jd, the relative slip of the braking wheels S was determined.
The adhesion coefficients were determined by formula (4).
After calculating the adhesion coefficients based on jd, the data of the adhesion coefficients and relative slip values were obtained for all sections. After that the graphical views of the adhesion coefficients with respect to the relative slip (the φ–S diagram) for nonstudded and studded winter tires were reconstructed (Fig. 6).

Fig. 6 Characteristics of longitudinal friction coefficients on ice road with respect to the relative slip (the φ-S diagram) for winter non-studded and studded tires Yokohama iceGUARD Stud IG35.
To determine the adhesion coefficient between the tire and the road surface, a new method was used, based on an analysis of the slip of the wheels during braking. Using this method, the form of the φ–S diagram of the studded tire on ice was detected.
The test results were obtained for a single brand and model of the studded tire. To confirm the findings, it is necessary to collect statistics on the evaluation of the adhesion properties of the studded tires of various brands. We believe that the different nature of the φ–S diagrams of the studded and non-studded tires on ice requires appropriate adaptation of the electronic active safety system algorithms.
Advantages of the developed method are:
– More accurate determination of the adhesion coefficient;
– Determination of the optimal slip value at which the maximum adhesion coefficient for each axis is ensured; the prospect of improving the algorithms of the active safety systems;
– The possibility of determining the φ–S diagram in road conditions without the use of special tire testers (including those for the studded tires);
– Less laboriousness of the tests, associated with determining the maximum adhesion coefficient when braking with one axis (especially on roads with a low adhesion coefficient).
The disadvantages of the applied method include:
– The need to install and configure the complex test equipment that provides high accuracy of measurements.
An analysis of the constructed φ–S diagrams (Fig. 6) shows that for the studded tire the φ–S maximum shifts toward the large relative slip. This fact can lead to a decrease in the effectiveness of the electronic active safety systems.
Further research. It is planned to test the effectiveness of the electronic active safety systems on a car equipped with various types of tires, including studded ones, on icy roads. When confirming a significant decrease in the effectiveness of the electronic active safety systems when tires are studded, recommendations for improving their control algorithms will be developed. To do this, it is also necessary to determine the lateral adhesion characteristics of studded tires on ice.
The authors of the paper would like to express sincere gratitude to YOKOHAMA RUSSIA LLC for the support and tires provided for the experimental research.
Copyright © 2026 Research and Reviews, All Rights Reserved