
ISSN (0970-2083)
ISSN (0970-2083)
Devaki K1*, Akila Devi R2 and Vidhupriya P2
1Professor, Department of Computer Science, Rajalakshmi Engineering College, Tamilnadu, India
2Asst. Professor Department of Computer Science, Rajalakshmi Engineering College, Tamilnadu, India
Received Date: 07 August, 2017; Accepted Date: 20 September, 2017
Visit for more related articles at Journal of Industrial Pollution Control
Fissure segmentation and detection of fissures in lung CT images is essential in the clinical practice for the interpretation and diagnosis of diseases present in the lungs. A novel supervised learning approach using multilayer back propagation neural networks is employed to segment the fissures. The pixels present on the fissures are classified based on the feature set calculation. An optimized feature subset selection is done to enhance the performance. The classifier is trained with the known input to achieve the targeted output. The ground truth for the classification is provided by an expert observer. The method overcomes the necessity of manual intervention required in training the classifier used in the previous conventional methods. The back propagation neural network adjusts the weights and minimizes the mean square error to overcome the tedious process of selecting the training data to train the classifier. The method was investigated with 365 CT images from 15 CT examinations. The performance index of the proposed method is measured to be good with an area 0.98 under ROC curve.
Supervised, Classifier, Lung CT images, Fissures, Segmentation, Neural networks
Pulmonary diseases are the primary reason of death according to a recent World Health Organization (WHO) report approximating to 7.7 million deaths worldwide. High resolution computed tomopography (HRCT) is the widely adopted imaging modality for the clinical interpretation of pulmonary diseases. Manual analysis and interpretation from the large volume of CT data is tedious and time consuming. Automated system that helps in the assessment process of the clinicians is thus essential.
A human lung is divided into right and left lung separated by the hilar region as shown in (Figure 1) The right lung is separated into three compartments consisting of upper, middle and lower lobes. The upper and middle lobes of the right lung are divided by the right horizontal or minor fissure and the right oblique fissure separates the middle and lower lobes (Devaki and Murali Bhaskaran, 2014). The left lung upper and lower lobes are divided by the left oblique or major fissure. A double layer of visceral pleura representing extensions of the pleural space between the lobes of the lungs forms the fissure surface (Rikxoort, et al., 2008). The lobar fissures are seen as low contrast surfaces with blurred boundaries in cross sectional CT images (Zhang, et al., 2006). On CT images of 1-3 mm thickness, the fissures can be found as a thin curve with much noise compared to the tissues surrounding it. (Wang, et al., 2006). Automation of fissure segmentation process helps the doctor to detect the fissures in the large stack of CT data. The identification and segmentation of pleural fissures is of clinical importance as the pathology of the lungs is assessed on lobar basis. The fissures are the landmarks in the lungs and the detection of fissures facilitates the development of a CAD system that helps in the assessment of bening and malignant nodules present in the lungs quantitatively. The fissures are also used as a reference to find the location a tumor that moves when humans respire and the spreading of various lung diseases spreading over the lobar areas (Wang, et al., 2006). Pulmonary fissure segmentation provides a basis for lobe segmentation that facilitates preoperative planning and postoperative assessment for the surgeons (Figure 1).

Figure 1: Anatomy of lungs with fissures.
The segmentation of fissures is a challenging task as the fissure appearance varies in a stack of CT slices of the patient study set. It has a fuzzy appearance with varied shapes due to the respiratory motion of the individuals. Incompleteness of fissures also poses a problem in the delineation process. Presence of partial volume effect, noise artifacts, fissure like structures and other anatomical regions make the segmentation process difficult to address. This paper proposes a supervised pattern recognition approach for fissure segmentation in lung CT images. The related works are discussed in section II. In section III, the proposed method is explained. Section IV provides the experimental method. The results are illustrated in section V and discussed in section VI. A conclusion is provided in section VII. The architecture diagram of the proposed method is as shown in (Figure 2).

Figure 2: Architecture diagram of the proposed method.
Many authors have proposed various methods in the recent years for the identification and delineation of fissures in lung CT images. The earlier methods proposed varies primarily on the dependence of the anatomical nature of fissures and their completeness. (Zhang, et al., 2006) proposed an anatomic atlas construction using prior anatomical information to seed the fissure detection. The method may fail in cases of uncommon anatomy or incomplete fissures as the atlas construction was based on the available data.
A method was proposed (Wang, et al., 2006) to construct the fissure by employing curve growing process. A starting curve segment was identified and the curve growing process was completed adopting the energy function. The method was found to be accurate and robust. (Qiao, et al., 2008) experimented a method based on the fissure sweep. An adaptive fissure sweep was applied to find out the fissure region automatically and the fissure angle was obtained. The anatomical variations were not considered and may fail in unusual cases. (Jiantao, et al., 2009) adopted an extended Gaussian image based method to locate the fissures. The method was found to be robust as it was independent of anatomical knowledge. A distance calculation based method was proposed (Soumik and Reinhardt, 2009) to segment the fissures. The airways and vessels were segmented and a distance map calculation of the blood vessels structure was done. The fissure position region of interest was then located followed by a 3D graph search to find the best fissure position. The accuracy of the results obtained depends on the vasculature structure segmentation and in case of diseased subjects it may be incorrect.
Supervised methods were proposed in the earlier works (Ochs, et al., 2007; Rikxoort, et al., 2009) to delineate the fissures. The method adopted classification techniques using the feature set calculated and the fissure structure was classified. Manual intervention was required to choose the data and the training was tedious with varied data set. Two methods were proposed by (Ross, et al., 2009; Ross, et al., 2010) to segment the fissures. The earlier work involved user intervention and thin plate spline interpolation procedure was then applied to finish the fissure segmentation. An automated method was followed in the second work using eigen values of Hessian matrix and MAP estimation. However, the method did not work for missing or incomplete fissures. Fissure segmentation was proposed based on lobe segmentation (Lassen, et al., 2013). The fissures were enhanced using eigen values of Hessian matrix and two features were extracted from it. The unique feature of image structure and the differentiating factor with the other structures were calculated. These features observed gave the overall fissure similarity measure and it was used for segmenting the lobes. Neural networks (Middleton and Damper, 1996) was applied for the identification of lung borders in MR images. The method employed training techniques that included multi slice training and weight elimination. The technique proved to improve the performance by removing smaller weights. (Singh, et al., 2005) proposed selfadaptive RBF neural networks to segment medical images of the brain. The system applied a confidence measure to select a subdivision of RBF in the hidden layer to produce output and making it self-adaptive. A conventional k-means algorithm identified the centers of the different RBFs. The method was found to be better than k-means and FCM. (Cascio, et al., 2006) developed a system to classify mass lesions by neural networks. The segmentation of mammograms was done by first applying Hunter algorithm to locate the ROI. Feature extraction was done to train the neural network with momentum. The method proved to give good results with sensitivity of 82%.(Ceylan, et al., 2010) proposed a method for lung segmentation using combined complex valued artificial neural networks. The process operates in two levels, where, in the primary level the CVANN was trained using original data set. The outcome of the primary level and target of the original data were present as input to the second level of CVANN. The average accuracy of the method was given as 99.8%. The method can easily be adapted to the new set of data. (Ertas, et al., 2012) adopted multistate cellular neural networks to segment breast region from MR images. The method performed well even with artifacts and found to be effective with manual guidance. In the proposed method, a pattern recognition based supervised segmentation approach using a neural network was adopted to segment the fissures. The neural network was given training to classify the pixels as belonging to the fissure surface and non-fissure area. The results were evaluated to obtain the area under the ROC curve.
The proposed method uses a pattern recognition based approach to train the classifier based on supervised learning. A back propagation multilayer perceptron neural network is accomplished to classify the pixels present in the fissures and non-fissure regions. The ground truth for fissure segmentation is obtained from the human observer. The results of the supervised classification are matched with the ground truth to validate the accuracy.
A supervised classification method consists of two phases, training phase and test phase. In the training phase the system is trained with known input and expected output and in the testing stage the system is applied to unknown data. In the training stage, the classifier is trained with the feature set calculated for the pixels sampled from the training data set. The trained classifier is then applied to classify unseen test data set. The ground truth required for training the classifier is provided by an expert radiologist.
The method overcomes the necessity of manual intervention required in training the classifier used in the existing conventional methods. The manual selection of training data is time consuming and tedious. The classifier has to be trained for new set of input data and the accuracy of the method lies on the training of the classifier. The proposed method adopts back propagation multilayer perceptron neural network for classifying the pixels on the fissure region. The back propagation network propagates the error backwards to adjust the weights of the neurons in the hidden layer. The weights are adjusted until the mean square error reaches the validation point. The manual intervention necessary for training is avoided and the classifier can be applied for new training data set as well.
Pre-processing
Preprocessing of the input lung CT image is done by applying contrast enhanced adaptive histogram equalization (CLAHE). CLAHE is applied to remove the artifacts present and obtain a uniform contrast limiting, thereby avoiding the over contrast problem of AHE. The CLAHE algorithm calculates the histogram of the image by dividing the image into specified grid size. For each of the grid specified, a grid point is identified in the image starting from the top left corner. Histogram is calculated for each of the grid point with respect to the region around it. The histogram obtained is then clipped considering the clip-limit and a new histogram is constructed to calculate Cumulative Distribution Function (CDF). Each pixel in the image is considered and the CDF is calculated. A mapping is done for each of the pixel at the four closest grid points based on their CDF. Interpolation of the values is done to get the mapping at the current location and values are assigned to the current pixel. The resulting image after preprocessing is as shown in (Figure 3).

Figure 3: a) Original image b) Pre-processed image.
Feature Set Extraction
The seisThe segmentation of an image is the process of classifying the pixels as belonging to different homogenous regions. The pixels are characterized by certain features and this feature set extraction is essential for training the classifiers. In the proposed work, four different features similar to the work proposed by (Eva, et al., 2008) are analyzed to obtain the feature set.
Second Order Gaussian Derivatives
The second order Gaussian derivatives are calculated to highlight transition in intensity and detect edges. The isotropic filters are rotation invariant and they are independent of the direction of the discontinuities. It gives a zero value in constant intensity areas and non-zero along a change in the intensity value. The Gaussian derivatives of the image f(x,y) is given by
s(x,y) = f(x,y) * g(x,y) where, (1)
g(x, y) = 1⁄2πσ2 e−(x2+y2)/2σ2 (2)
The second order derivatives are calculated at different σ values 1,3,5,7 and totally 24 values are obtained. L,Lx, Ly, Lxx, Lyy, Lxy are the second order derivatives obtained to extract the features of the pixels in the training set.
Gradient
The gradient of an image gives the directional change of intensity. The gradient of the image gives information about the intensity change and is used in edge detection. Given the original image I, the gradient change in horizontal and vertical directions are given by convolving the image with 3 × 3 kernels.
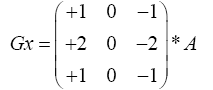 (3)
(3)
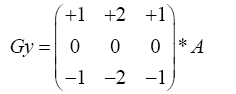 (4)
(4)
The change in intensity from the fissure region to non-fissure region is calculated to extract the features of pixels on fissure region.
Eigen values of Hessian matrix
Hessian matrix is a square matrix giving description of second order partial derivatives of a function. Considering the plate like structure of fissure, the eigen values are extracted from the directional information of the curvature. The three eigen values λ0, λ1 and λ2 denote the principal direction of the local curvature (Eva van M. Rikxoort et al., 2009) in a 3-D image. The eigen value of the curvature perpendicular to the fissure is large and the other two eigen values parallel to the fissure plate are small. λ0 is considered to be large at a fissure, as one moves the Hounsfield unit changes from low to high to low. λ1 and λ2 values are low as the fissures is constantly plane. The fissure pixels are differentiated from nonfissure pixels based on the information from the above three eigen values. In our proposed work, we consider Eigen values λ0 and λ1 for a 2-D image.
Gray Level Information
The gray level or intensity value of each pixel is considered as a feature to classify the pixels. The intensity of a pixel on a fissure varies from the surrounding region.
Feature Subset Calculation
The feature set extracted contains totally 41 features obtained at different scales of σ = 1,3,5,7. The Gaussian second order derivatives (L, Lx, Ly, Lxx, Lyy, Lxy) at different scales add upto 24 features. The eigen values of the Hessian matrix provides 12 features and gradient values at four scales are considered. The gray value information is added to the feature set to complete it.
The training of the classifier with all the features extracted will degrade the performance of the system. Calculation of the feature subset is essential to enhance the performance of the system and obtain the desired output. The feature set calculation is done by applying a mask with predefined values. Pixels with the conditional criteria such as non-zero gradient values and λ0 ≥ λ1 is considered for training the classifier. The corresponding gray levels are used to identify the required region. The classifier is trained to classify the pixels with the specified features as present on the fissures. Table 1 gives the optimal feature set selection for training the classifier Table 1.
| s | Eigen Value | Second Order Derivatives |
|---|---|---|
| 1 | l0 l1 | Lx, Lxy |
| 3 | l0 l1 | Ly, Lyy |
| 5 | l1 | Lyx |
| 7 | l0 | Lxx |
Table 1: Example feature subset selection values
The proposed design of a multilayer perceptron neural network consists of three layers with an input layer, an output layer and a hidden layer with 20 neurons. In supervised learning the network is trained using samples of input training set. The input training set is applied to update the hidden layer with 20 neurons. In supervised learning, the network is trained using samples of input training set. The input training set is used to update the weights and the input pattern is a set repeated in a random order. The validation set decides the stopping criteria by monitoring the error measure.
The neural network is trained using back propagation algorithm that tunes the weights to optimize the performance of the classifier. The algorithm operates in two pass – a forward pass that computes the outputs of all units in the network and the error of the output layer. In the backward pass, the error in the output layer is used for updating the weights by propagating backwards. The back propagation is done by calculating the local gradient at each layer.
The performance of the system is measured by mean square error – the average of the squared error between the networks output and the target output t.
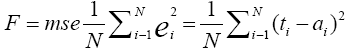 (5)
(5)
The target output is 1 for pixels on fissure region and 0 for non-fissure region. The validation point is set as 0.01 for the classifier to stop updating the weights and the targeted output is obtained. The number of epochs required for the proposed method to achieve the specified validation point is 20 epochs.
The method was validated with 365 Lung CT images of 15 CT examinations consisting of both normal and abnormal subjects. The experiments were carried out using a 2.6 GHz Pentium IV system with 3 GB RAM. The images were acquired under normal dose with 140 Kv, 250 mA and thickness of 1.2 mm and represented using 512 × 512 matrixes. The CT images obtained for experiments were divided into training data set and test data set. The training set contained 185 images and the remaining were used for testing. An expert observer marked the fissures from the fourth or fifth slice of CT examinations in the training set. The feature subset obtained after feature extraction is involved in training the classifier for the 185 images of the training set. The training images were selected such that the three lobar fissures are visible in one or more images and experiments were done to obtain the segmentation results. The validation of the performance of the proposed method is done by matching the actual output with the targeted output. The classifier is trained and the weights are updated till the specified validation point is reached. The ground truth for the experiments is provided by an experienced radiologist and he manually selected the positive pixels present on the fissures and negative pixels present on non-fissure region for all the 185 images. The manual pixel selection by the experts started from every fourth or fifth slice of the data set as the fissures are clearly visible only from these slices. The accuracy percentage of the method is measured by calculating the mean square error between the target output and the actual output. The accuracy of the method is given in terms of the error percentage and area under ROC curve.
The results observed from our experiments with lung CT test images are shown in (Figure 4). The results in the (Figure 4) show the results obtained by the proposed method for segmenting the fissures. The fissures traced in (Figure 5) show that the method is applicable to segment all the visible fissures, right oblique, right horizontal and left oblique fissures (Table 2).
| Fissure Type | Number of Expert Selected Points(Target) |
Number of Matching Points(Actual) |
Absolute Error (In Pixels) |
Percentage Error |
|---|---|---|---|---|
| Right Oblique Fissure | 150 | 148 | 02 | 1.33 |
| Right Horizontal Fissure |
150 | 145 | 05 | 3.3 |
| Left Oblique Fissure |
150 | 147 | 03 | 2.0 |
Table 2: Comparative error measurements for right oblique, right horizontal and left oblique fissures

Figure 4: Results of fissure segmentation a) and c) Original Image b) and d) Output with fissure segmentation.

Figure 5: Results of fissure segmentation a) Right Lung with Horizontal and Oblique fissures b) Right Horizontal and oblique fissures segmented c) Left Lung with Oblique fissure d) Left Oblique fissure segmented.
Table 2 summarizes the results observed for the test data sets in terms of the number of matching points and error percentage. From the results it could be observed that the method worked well for the oblique fissures compared to the horizontal fissures. The error percentage for the oblique fissures is less compared to the horizontal fissure. The classifier produced better results in segmenting the right oblique fissure than the left oblique fissure. The results for the right horizontal fissure show higher error percentage as it is less visible in transverse views due to the parallel orientation.
Table 3 gives the ROC analysis for the proposed method in comparison to the existing supervised approach using knn classifier. The results obtained for the major and minor fissures separately show better performance compared to the knn classifier. The overall performance of the system is in comparison to the results given in previous methods. (Figure 6) gives the ROC curve obtained in terms of sensitivity and specificity.
| Fissure Type | Proposed Neural Networks | KNN classifier |
|---|---|---|
| Major | 0.95 | 0.91 |
| Minor | 0.94 | 0.92 |
| Total | 0.98 | 0.98 |
Table 3: Comparative error measurements for right oblique, right horizontal and left oblique fissures

Figure 6: ROC curve.
In the proposed method, a pattern recognition based supervised learning approach to segment the fissures in lung CT image is discussed and evaluated. The method proved to be better in performance compared to the supervised approach using other classifiers.
The supervised approach has many advantages compared to other non-supervised approach. The performance of the system depends completely on the training examples. Hence, given suitable examples, the system can be trained to test any structure. The method does not require a new system to be designed for new test data set with structural variations. The selection of optimized feature set improves the performance of the supervised approach. The design of non-supervised approach using feature set has specific application and can be applied for specific structures. Feature set optimization in a supervised approach makes it less sensitive to parameter variations and improves the performance of the classifier.
The tedious and time consuming manual intervention required in choosing the training parameters for classification is overcome in the proposed classifier method. The choice of k value for classification using knn classifier and choosing the feature set requires more computation time. The multilayer perceptron back propagation neural network adjusts the weights of the nodes based on the error propagated backwards until the validation point is reached. The classifier thus overcomes the necessity of manual intervention in choosing the training parameters and the method could be applied to new test data set.
Even though Feature extraction and optimized feature subset selection required for training the classifier extends the computation time, the training time is trivial comparing the advantages and performance of the supervised approach using neural networks Table 3 and (Figure 6).
A new pattern recognition based supervised learning approach using neural network is proposed to detect and segment the fissures in lung CT images. The method employs multilayer back propagation neural networks to segment the fissures. The classifier is trained with positive pixels present on fissure region and negative pixels present on non-fissure regions. A set of features of the pixels is extracted and optimized feature set is obtained to train the classifier. An expert observer provided the ground truth to validate the performance of the classifier. The classifier is tested with the test set of CT images and the performance is evaluated. The classifier is found to be accurate and reliable with a good performance of area 0.98 under ROC curve.
Copyright © 2024 Research and Reviews, All Rights Reserved