
ISSN (0970-2083)
ISSN (0970-2083)
Kwok-yii Leong1, Sylvia See1, Jun-Wei Lim2*, Mohammed J.K. Bashir3*, Man-Kee Lam4 and Thiam-Leng Chew4
1School of Chemical Sciences, Universiti Sains Malaysia, 11800, Penang, Malaysia
2Department of Fundamental and Applied Sciences, Universiti Teknologi Petronas, 32610 Seri Iskandar, Perak Darul Ridzuan, Malaysia
3Department of Environmental Engineering, Faculty of Engineering and Green Technology, Universiti Tunku Abdul Rahman, 31900 Kampar, Perak, Malaysia
4Department of Chemical Engineering, Universiti Teknologi Petronas, 32610 Seri Iskandar, Perak Darul Ridzuan, Malaysia
Received date: 28 November, 2016; Accepted date: 20 February, 2017
Visit for more related articles at Journal of Industrial Pollution Control
The interest of present study focuses on the optimization of key process variables in enhancing the simultaneous adsorption process of phenol and 4-chlorophenol (4-CP) from their binary solution using response surface methodology (RSM). The interactive effects of spherical activated carbon (SAC) dosage, pH of solution and contact time were statistically analyzed via central composite design (CCD) of batch assessments. The CCD derived models of phenol and 4-CP removals were statistically found providing a satisfactory approximation to the real system. Among the exploited process variables, contact time was classified by the models to contribute the least effect on simultaneous adsorption process of phenol and 4-CP. The gradual increase of pH would undermine the effectiveness of adsorption process, though the SAC dosage and contact time responded reversely. The systematic statistical consideration of process variables found the optimum interaction occurred at the contact time of 24 h, SAC dosage of 0.09 g and pH of 7 with the attainable adsorption capacities of phenol and 4-CP in the ranges of 47% to 49% and 88% to 93%, respectively. Verification by experimental run was performed with phenol and 4-CP removals found at 49% and 92%, respectively, which were in agreement with the CCD predicted values.
Simultaneous adsorption, Process variable optimization, Central composite design, Phenol, 4-Chlorophenol
As water is an essential component in all forms of life, contamination of fresh water by phenol and its derivatives due to their wide applications has become a serious universal problem. The impingement of phenolic compounds to the receiving water bodies is significantly deleterious to the environment because of their high toxicity, recalcitrant and bio-accumulation (Doocey, et al., 2004; Lim, et al., 2013a; Lim, et al., 2013b). To bring it further, these compounds are as well suspected to be carcinogenic and mutagenesis to living organisms. Thus, the World Health Organization (WHO) has set a limit of 1 mg/L in regulating the phenol concentration in potable water (Kilic, 2009; Lim, et al., 2013c).
These days, the discharge of wastewaters containing phenolic compounds to the environment either on purpose or by accident has become inevitable due to widespread use in many industrial processes, viz., in the production of plastics, coal-coking, nylon, polymeric resins, lubricant additives, wood protectors, bleached pulp, dyes, textile, explosives, insecticides, herbicides and biocides (See, et al., 2013; Tobajas, et al., 2012). In 1989, the annual industrial production of chlorophenols was estimated at 200,000 tons (Tobajas, et al., 2012; WHO 1989). Out of this, approximately 190 ton/month of phenolic wastes were disposed primarily by petrochemicals, pharmaceuticals and polymer industries (Khan and Anjaneyulu, 2005). In the United States alone, the quantity of phenol and chlorophenols wastes generated in industries were amounted to 56,000 and 1900 tons, respectively, in 1999 (Tarighian, et al., 2003; Tobajas, et al., 2012). The industrial wastewaters are characterized by variable concentrations of phenolic compounds generally ranging between 500 and 4000 mg/L (Tobajas, et al., 2012). In a coal processing industry, the produced wastewater can contain phenol concentration up to 6800 mg/L (Busca, et al., 2008; Dotto, et al., 2013). In the case of monochlorophenols, the effluent concentrations ranging from non-detectable to 20 mg/L had been reported by WHO (1989). In view of the phenolic compound contents particularly in the industrial wastewaters, treatment of these streams is indispensable in order to mitigate the toxicity effects that are plausibly inflicting serious damage to the environment upon the disposal.
Accordingly, effective cost saving method, i.e. biological treatment system via aerobic and anaerobic processes has been frequently employed to treat wastewater containing phenolic compounds (Hoyos-Hernandez, et al., 2013; Lim, et al., 2012; Lim, et al., 2013c). However, as phenolic compounds are usually toxic and recalcitrant in nature, the microorganisms present in activated sludge process are often inhibited and incompetent to bioremediate wastewaters containing high concentration of phenolic compounds. (Lim, et al., 2012) had documented that increasing 2,4-dichlorophenol concentration to merely 30 mg/L had caused fatality to the activated sludge process which was also vindicated by (Sahinkaya and Dilek, 2007) in the batch bioreactor studies, showing self-inhibition at 2,4-dichlorophenol concentration of 25 mg/L. To top it off, typically, lengthy steady state of acclimation period is required before the activated sludge can be used to treat wastewater laden with phenolic compounds (Lim, et al., 2013a).
Owing to the limitations demonstrated by bioremediation systems, physical and chemical techniques used to treat wastewaters containing phenolic compounds have gained increasing recognition among the worldwide researchers (Xiong, et al., 2011). Among these techniques, the popularity of adsorption process continues unabated for years to weed out various phenolic compounds from the wastewaters (Gupta, et al., 2014; Hamdaoui, et al., 2003; Pulido Melian, et al., 2007; Wernert, et al., 2006;
Yang, et al., 2014). The adsorption onto the activated carbon has been found to outperform the other physicochemical methods in terms of its capability of successfully adsorbing a broad range of adsorbates; besides its simplicity of design (Salman, 2014). In view of this matter, the superior competency of activated carbon could be rationalized by its characteristics, explicitly large surface area, micro-porous structure, high adsorption capacity and large surface chemical nature which results in extensive degree of surface reactivity (Bharathi and Ramesh, 2013; Quintelas, et al., 2006). The mechanism of adsorbates removal was as well delineated by (Bharathi and Ramesh, 2013) which involves four primary steps as outlined below:
i. Migration of adsorbates from the bulk solution to the surface of the adsorbent;
ii. Diffusion through the boundary layer to the surface of adsorbent;
iii. Adsorption at the site;
iv. Intraparticle diffusion into the interior of the adsorbent.
The use of rubber tire activated carbon to treat phenolic-bearing wastewater was carried out by (Gupta, et al., 2014) which owned adsorption capacities of 71 mg/g for p-cresol and 48 mg/g for phenol. In the study performed by Yang, et al., modification of activated carbon via amination process had brought about the enhancement of phenol adsorption capacity which was attributed to the strengthened of π-π dispersion between phenol and basal plane of activated carbon by pyridine, pyrrolic N. Also, the exploitation of powdered and granular activated carbons to adsorb various phenolic compounds had been reported by many researchers since years ago, (Hamdaoui, et al., 2003; Ivancev-Tumbas, et al., 2008; Oh, et al., 2012; Shao, et al., 2013).
In fact, most efforts were only focused on the adsorption studies in aqueous solutions containing single phenolic compound. The industrial wastewaters generally contain phenol and its derivatives simultaneously. Hence, from a practical viewpoint, the results of adsorption from binary or multisolute systems are more relevant. To date, only little information is however available in literature vis-à-vis the simultaneous removal of phenol and 4-chlorophenol (4-CP) from their binary mixture via adsorption by activated carbon. And so, research attempts spearheading to this direction are deemed crucial to render more understanding for plausible future application in the wastewater treatment facilities.
In general, the adsorption of solutes from aqueous solution by any adsorbent is influenced by many factors, e.g., adsorbent dosage, contact time and solution pH. The sequentially optimization of single factor at a time as done traditionally, often overlooks interactive effects of various factors on the adsorption process, in addition to the requirement of large number of experimental runs which are costly and time-consuming. These drawbacks however can be overcome by the statistical design of experiments, which reduces the number of experiments and provides an appropriate model for process optimization. In this regard, response surface methodology (RSM) plays a useful role to analyze and determine the optimum conditions of interactive factors within the design space of the experimental study (Liu, et al., 2013; Myers, et al., 2009).
This work primarily deals with the simultaneous uptake of phenol and 4-CP via adsorption by spherical activated carbon (SAC). SAC was chosen in this study due to considerable various potential advantages over the other forms of activated carbon such as extremely low resistance to liquid diffusion, higher adsorption efficiency, better mechanical properties and more resistance to abrasion (Oh, et al., 2009). RSM was committed to optimize the key factors impinging the simultaneous adsorption of phenolic compounds to SAC.
Materials
This research used SAC with a trade name of ‘SPHERICAL SHIRASAGI X7100H (DRY)’ purchased from Japan EnviroChemicals, Ltd. The SAC is a coal based spherical activated carbon and being produced through steam at high temperature. Specifically designed for wastewater treatment, the standard specifications of SAC as obtained from manufacturer are shown in Table 1. On top of that, the physicochemical characteristics of SAC as determined in laboratory are presented in Table 2. The adsorption capacities of phenol and 4-CP by SAC revealed in this table were separately determined at natural pH.
| Tested parameter | Specification |
|---|---|
| Loss on drying (wt%) | < 3.0 |
| Filling bulk density (g/mL) | 0.470-0.550 |
| Particle size within 0.50-2.36 mm (wt%) | >98.0 |
| Average particle size (mm) | 1.30-1.60 |
| Coefficient of uniformity | <1.50 |
| Hardness (wt%) | >93.0 |
| pH | 5.0-8.0 |
| Ignition residue (wt%) | <3.0 |
Table 1. Standard specifications of SAC as obtained from manufacturer
| Parameter | Measured value |
|---|---|
| BET surface area (m2/g) | 774 |
| Micropore area (m2/g) | 557 |
| External surface area (m2/g) | 217 |
| Total pore volume (cm3/g) | 0.465 |
| Micropore volume (cm3/g) | 0.273 |
| Mesopore and macropore volume (cm3/g) | 0.182 |
| Average pore width (nm) | 2.4 |
| Average pore diameter (nm) | 4.75 |
Table 2. Physico-chemical characteristics of SAC as determined in laboratory
The solids phenol and 4-CP used were purchased from Merck Chemicals (Malaysia) and of synthesis grade with >99% purity. Stock solutions containing 1000 mg/L of phenol and 4-CP were prepared by dissolving these solids in distilled water and individually stored in an amber glass bottle at room temperature prior to use by dilution to the required concentration. The degradation of phenol and 4-CP in the stock solutions during the storage remained undetectable.
Simultaneous phenol and 4-CP adsorption study
The simultaneous adsorption of phenol and 4-CP onto and into the SAC in their binary solution was investigated via batch experiments. All trials were performed by shaking 20 mL of binary solution containing 300 mg/L of phenol and 4-CP each in well capped 25 mL cylindrical flasks with diameter of approximately 30 mm. The orbital shaker, model IKA KS Basic 260, provided shaking speed of 250 rpm and the experiments were run at the temperature of 25°C ± 1°C. Immediately after each run, the binary solution was examined for phenol and 4-CP concentrations. The removal efficiencies of phenol and 4-CP from the binary solution were subsequently calculated via the following equation:
 (1)
(1)
where Ci and Cf are the respective initial and final concentrations of phenol or 4-CP. The key interactive factors or process variables, viz., SAC dosage, pH of solution and contact time of binary solution with SAC, which affected the simultaneous adsorption of phenol and 4-CP to SAC were assessed with the aids of RSM.
Analytical methods of analyzing phenol and 4-CP concentrations
The concentrations of phenol and 4-CP in the binary solution were analyzed using a UV-Vis spectrophotometer, model Shimadzu U-2600. Hereafter, the method of quantification followed closely the procedure outlined by (Khan, et al., 1997). To enhance the accuracy and precision of measurement, the structures of phenol and 4-CP were initially converted into the molecular form via acidification with 1 M of HCl solution for both blank and sample. The concentrations of phenol and 4-CP in the binary solution were then obtained as the function of absorbance with regard to the λmax of phenol and 4-CP at 270 nm and 280 nm, respectively. Their concentrations were subsequently calculated from the following equations [Eqs. (2) and (3)] which were substituted with the measured absorbance values of the sample and solved simultaneously:
 (2)
(2)
 (3)
(3)
where A270 and A280 are the absorbance at λmax of phenol and 4-CP, respectively, C1 and C2 are the concentrations of phenol and 4-CP, respectively, and b is the path length of the sample. Next, the ε11 and ε12 represent the molar extinction coefficients of phenol and 4-CP at λmax of 270 nm, respectively, while ε21 and ε22 represent the molar extinction coefficients of phenol and 4-CPat λmax of 280 nm, respectively. The molar extinction coefficients of phenol and 4-CP at each λmax were preliminary acquired from the standard calibration runs. Their values were 0.0151 and 0.0095 L/mg.cm with respect to ε11 and ε12 and 0.0063 and 0.0137 L/mg.cm with respect to ε21 and ε22.
Design of experiment using RSM
Design-Expert® Version 7.0 (Stat-Ease, Inc., Minneapolis, MN 55413) software was employed to provide a platform for RSM to analyze and optimize the simultaneous adsorption of phenol and 4-CP to SAC. The most widely exploited approach of RSM, i.e. central composite design (CCD), was used to evaluate the correlation between the process variable and the response (Bashir, et al., 2011). Vindicated by Guven, et al., CCD is an effective design tool that is ideal for sequential experimentation as it permits reasonable volume of information to test lack of fit when a sufficient number of experimental values exist. The three significant process variables considered in the phenol and 4-CP adsorption studies were SAC dosage (A), pH of solution (B) and contact time (C) as demonstrated in Table 3. Each process variable was numerically varied over three levels between -1 and +1 at the real value range determined from the preliminary experiments. The monitored responses were the percentage removals of phenol and 4-CP from the binary solution. The design of experimental conditions based on CCD is illustrated in Table 4. The total number of experiments from the consequential three process variables were attained as 20 (=2k+2k+6), where k is the number of process variables (k=3). Fourteen experiments were augmented with six replications at the center point of each process variable to fit the second-order polynomial response surface model of quadratic equation and assess the pure error (Bashir, et al., 2010; Bashir, et al., 2011).
| Process variable | Code | Real values of coded levels | ||
| -1 | 0 | 1 | ||
| SAC dosage (g) | A | 0.05 | 0.07 | 0.09 |
| pH of solution | B | 6 | 9 | 12 |
| Contact time (h) | C | 8 | 16 | 24 |
Table 3. Range of process variables and their respective levels in CCD design
| Run No. | Point type | Process variable | Response | |||
| A: SAC dosage (g) | B: pH of solution | C: Contact time of binary solution with SAC (h) | Phenol removal (%) | 4-CP removal (%) | ||
| 1 | Axial | 0.05 | 9 | 16 | 17 | 38.3 |
| 2 | Factorial | 0.05 | 12 | 8 | 10.3 | 19.7 |
| 3 | Centre | 0.07 | 9 | 16 | 28 | 54.7 |
| 4 | Factorial | 0.09 | 12 | 24 | 15.3 | 36.3 |
| 5 | Centre | 0.07 | 9 | 16 | 27 | 54.3 |
| 6 | Centre | 0.07 | 9 | 16 | 32.7 | 69 |
| 7 | Factorial | 0.05 | 6 | 8 | 16 | 58.3 |
| 8 | Axial | 0.07 | 9 | 24 | 36.7 | 70 |
| 9 | Axial | 0.09 | 9 | 16 | 44 | 77.3 |
| 10 | Centre | 0.07 | 9 | 16 | 32.7 | 65.3 |
| 11 | Factorial | 0.09 | 6 | 24 | 49.3 | 93 |
| 12 | Centre | 0.07 | 9 | 16 | 28.7 | 59 |
| 13 | Factorial | 0.09 | 6 | 8 | 43.3 | 90.7 |
| 14 | Centre | 0.07 | 9 | 16 | 33.3 | 67.7 |
| 15 | Factorial | 0.05 | 12 | 24 | 11 | 27.3 |
| 16 | Factorial | 0.05 | 6 | 24 | 23.7 | 70.3 |
| 17 | Axial | 0.07 | 6 | 16 | 31.3 | 74.3 |
| 18 | Axial | 0.07 | 9 | 8 | 20 | 46 |
| 19 | Axial | 0.07 | 12 | 16 | 11.3 | 30.7 |
| 20 | Factorial | 0.09 | 12 | 8 | 10 | 25.7 |
Table 4. Experimental matrices based on CCD design and their respective measurements attained
Basically, the relationship between the input of process variable and the response is given as:
 (4)
(4)
Where Y is the response, f is the unknown function of the response, x1, x2, x3… xk are the input of process variables that can affect the response, k is the number of process variables and ε is the random error component that represents other sources of variability not accounted for by Bashir, et al., and Montgomery. The Taylor series expansion of Eq. (4) through second-order terms, contain all model terms through order two, would result in a model of the type (Myers, et al., 2009):
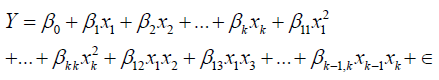 (5)
(5)
The Eq. (5) could be simplified to:
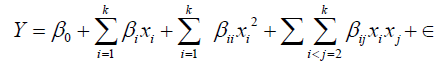 (6)
(6)
where Y is the response, xi and xj are the process variables, β0 is the constant coefficient, βi, βii and βij are the interaction coefficients of linear, quadratic and second order terms, respectively, k is the number of process variables and ε is the random error component. The matrix notation of the model is given by Bas and Boyaci:
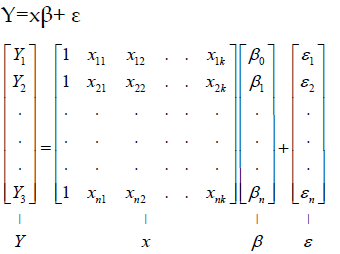 (7)
(7)
Owing to each process variable were varied into three levels Table 3, CCD commended quadratic model Eq. (6) in assessing the interactive effects of process variables and the consequential results of responses, in addition to predict the optimum conditions.
Analysis of variance (ANOVA) was later used for graphical analyses of the data to obtain the interaction between the process variables and the responses. The quality of the fitted quadratic model was expressed by the coefficient of determination (R2) and its statistical significance was verified by the F-value (Fisher variation ratio) and Adequate Precision (Bashir, et al., 2010). The instantaneous consideration of multiple responses involved the initial creation of a suitable response surface model and subsequently, identification of a set of operational condition that optimized the targeted response such in the most desired range (Bashir, et al., 2010).
The percentage removal efficiency results of phenol and 4-CP via adsorption from their binary solution are tabularized in Table 4. From 20 experimental runs, the percentage removal efficiencies of phenol were ranging from 10.0% to 49.3%. A broader range of removal efficiencies was noted in the 4-CP case, i.e. from 19.7% to 93.0%, plausibly due to stronger affinity towards SAC. This was also accentuated in the preliminary study in which higher individual adsorption capacity of 4-CP was recorded over phenol Table 2. As such, the presence of SAC in the binary solution was apt to adsorb 4-CP in all the experimental conditions designed by CCD.
Nevertheless, for both instances, the normal probability plots of internally studentized residuals indicate the data follow a normal distribution in which the points pursue closely the straight line (Fig. 1). Little scattering is foreseen even with normal data (Bashir, et al., 2011).

Fig. 1 Normal probability plots of internally studentized residuals for phenol (a) and 4-CP (b) removals.
Statistical analysis of adsorption models
The CCD design stands on second-order polynomial response surface model of quadratic equation is primarily used for process optimization (Myers, et al., 2009). Accordingly, Table 5 highlights all the model terms of quadratic equations of phenol and 4-CP removal (%) models. The models’ terms are derived by applying the factorial regression analysis on the experimental data indicated as responses in Table 4. The ANOVA assessment underscores the models significance for the removal (%) of phenol and 4-CP with Prob > F values of < 0.0001 Table 5. As demonstrated by Bashir, et al., the Prob > F of greater than 0.10 typically signify the statistical insignificance or inadequacy. Furthermore, as F-test of lack of fit describes the variation of the data around the derived model, negligible lack of fits is obtained from statistical analysis of models with Prob > F of greater than 0.10, implying significant correlation of models between the process variables and responses (Ghafari, et al., 2009). However, some of the models’ terms are insignificant and so have limited influence on the removal of phenol and 4-CP from binary solution. By excluding these model terms (with Prob > F of greater than 0.10), the ultimate empirical relationships between process variables and responses in terms of coded factors of response regression models are:
| Model | Source | Sum of squares | Degree of freedom | Mean square | F-value | p-Value |
|---|---|---|---|---|---|---|
| (Prob>F) | ||||||
| Phenol removal (%) | Model | 2574.68 | 9 | 286.08 | 16.86 | <0.0001 |
| A | 703.92 | 1 | 703.92 | 41.49 | <0.0001 | |
| B | 1117.25 | 1 | 1117.25 | 65.85 | <0.0001 | |
| C | 132.5 | 1 | 132.5 | 7.81 | 0.019 | |
| AB | 298.9 | 1 | 298.9 | 17.62 | 0.0018 | |
| AC | 1.05 | 1 | 1.05 | 0.062 | 0.8085 | |
| BC | 7.41 | 1 | 7.41 | 0.44 | 0.5236 | |
| A2 | 3.93 | 1 | 3.93 | 0.23 | 0.6407 | |
| B2 | 176.2 | 1 | 176.2 | 10.38 | 0.0091 | |
| C2 | 2.51 | 1 | 2.51 | 0.15 | 0.7088 | |
| Lack of fit | 130.47 | 5 | 26.09 | 3.33 | 0.1065 | |
| 4-CP removal (%) | Model | 8105.77 | 9 | 900.64 | 15.93 | <0.0001 |
| A | 1190.28 | 1 | 1190.28 | 21.05 | 0.001 | |
| B | 6095.96 | 1 | 6095.96 | 107.81 | <0.0001 | |
| C | 319.22 | 1 | 319.22 | 5.65 | 0.0389 | |
| AB | 201 | 1 | 201 | 3.55 | 0.0887 | |
| AC | 5.61 | 1 | 5.61 | 0.1 | 0.7592 | |
| BC | 1.9 | 1 | 1.9 | 0.03 | 0.8582 | |
| A2 | 3.14 | 1 | 3.14 | 0.06 | 0.8185 | |
| B2 | 111.52 | 1 | 111.52 | 1.97 | 0.1905 | |
| C2 | 2.07 | 1 | 2.07 | 0.04 | 0.852 | |
| Lack of fit | 352.16 | 5 | 70.43 | 1.65 | 0.2978 |
Table 5. ANOVA assessment of phenol and 4-CP removal (%) models from binary solution
Phenol removal (%)=30.01 + 8.39A – 10.57B + 3.64C – 6.11AB – 7.86B2 (8)
4-CP removal (%)=56.40 + 10.91A – 24.69B + 5.65C – 5.01AB (9)
The complementary significant statistical parameters of these modified quadratic equations of phenol and 4-CP removal (%) models are illustrated in Table 6. The coefficient of variance (CV) formulated as the ratio of the standard deviation of estimate to the mean value of observed response denotes the reproducibility of the model. The permissible upper fiducial limit of CV should not be greater than 10% to ensure the reproducibility of the model. In view of the R2 coefficient, Joglekar and May, suggested that a good fit model should have R2>0.8. According to (Myers and Montgomery, 2009), the R2 value closes to 1.0 is desirable and a reasonable conformity with Adjusted R2 value is required as shown in Table 6. There is only less than 10% of total dissimilarity that could not be explained by both modified models. To access the signal to noise ratio desirability, the adequate precision must be more than 4.0. The adequate precision obtained for modified phenol and 4-CP removal (%) models are 22.8 and 21.7, respectively, which indicate a sufficient signal and the models can be used to navigate the designed space. In tandem with these statistical agreements, the reliability of modified models in providing adequate approximation to the real system are verified in Fig. 2. In this figure, the actual values of phenol and 4-CP removals are closely accessorized their respective modified models revealing model satisfactoriness.
| Statistical parameter | Model | |
| Phenol removal (%) | 4-CP removal (%) | |
| Standard deviation | 1.61 | 4.59 |
| Mean | 26.08 | 56.4 |
| Coefficient of variance (%) | 6.17 | 8.14 |
| R2 | 0.9334 | 0.9003 |
| Adjusted R2 | 0.9096 | 0.8737 |
| Adequate Precision | 22.83 | 21.73 |
Table 6. Qualities of modified quadratic equations of phenol and 4-CP removal (%) models

Fig. 2 Predicted versus actual values plots for phenol (a) and 4-CP (b) removals.
Analysis of adsorption process
Based on modified models shown in Eqs. (8) and (9), the consequential perturbation plots (Fig. 3a and 3c) debunk the contact time had the least effect on the adsorption process of phenol and 4-CP from their binary solution as compared with SAC dosage and pH, manifested by their inconspicuous changes over the range of reference point. For all cases, the absolute values of percentage changes due to contact time were merely at 8% (Fig. 3b) and 11% (Fig. 3d) for the removals of phenol and 4-CP, respectively. On the flipside of phenol (Fig. 3b) and 4-CP (Fig. 3d) removals, the percentage changes caused by SAC dosage peaked at 29% and 32%, respectively, and pH peaked at 33% and 60%, respectively. Thus, the absolute values of percentage changes from the cube plots of phenol and 4-CP removals unveiled the effects of process variables on the adsorption process were in the descending order of pH>SAC dosage>contact time.

Fig. 3 Perturbation plots [(a) and (c)] and their respective cube plots [(b) and (d)] for phenol and 4-CP removals.
Furthermore, from the perturbation plots also highlight the increase of pH had a reverse effect as opposed to the increase of SAC dosage and contact time which intensified the adsorption process of phenol and 4-CP from their binary solution. This could be rationalized by the transformation of molecular to ionic forms of phenolic compounds as the pH increases. The surface repulsion effect due to charge similarity plausibly transpired at higher pH which prohibitively spurred the contact between adsorbent and asdorbates (Hegazy, et al., 2014). The adsorption of phenol by SAC was as well observed to be less dramatic at increasing pH range from -1.0 to 0.0 of coded unit which equivalent to pH 6 to 9, respectively, in comparison with 4-CP. Since phenol possesses higher pKa value than 4-CP (Dabrowski, et al., 2005), phenol is more resistant from being converted to its ionic form at this pH range, implicating in a stable adsorption of phenol.
The three-dimensional plots in Fig. 4 present the interaction effects of SAC dosage and pH on the adsorption of phenol and 4-CP from their binary solution at the contact time of 24 h. As the contact time had the least effect on the adsorption process, the removals of phenol and 4-CP via adsorption beyond 24 h was presumably insignificant. Ideally, the removals of phenol and 4-CP via adsorption increased with the increase of SAC dosage and the concurrent reduction of pH. On account of adsorption capacity, maximum adsorption was anticipated to occur at the upper and lower limits of SAC dosage and pH, respectively, i.e. with respect to 0.08 to 0.09 g and 6 to 8 ranges. A virtual complete removal of 4-CP and removal of half of phenol concentrations from their binary solution could be possibly achieved at this point. On another note, for all the experimental runs, the removal of 4-CP was noticed to be generally higher than phenol. The lost out of phenol in competing with 4-CP for the active site of adsorbent in their binary solution was directly associated with lower solubility of 4-CP as opposed to phenol. Asserted by Toth, et al., a poorly soluble solute would possess weak interaction with the solvent. Therefore, it is easily weeded out from the solvent as demonstrated by 4-CP which was being adsorbed to a greater extent by SAC in contrast with phenol. To top it off, the presence of chloro functional group will withdraw the electron cloud from the benzene ring of 4-CP molecule. Consequentially, this implicated on strengthening the interaction of 4-CP’s ring with activated carbon (Deng, et al., 1997).

Fig. 4 Three-dimensional plots for phenol (a) and 4-CP (b) removals at the contact time of 24 h.
Process variables optimization and verification
The optimum region where all the requirements of responses are simultaneously intercepted, known as sweet spot (Mansouri, et al., 2014), can be identified graphically by superimposing the contours of the response surfaces in an overlay plot. The goal of process variables were set within the range except for the contact time being predetermined at 24 h whilst the responses were placed at maximum to attain the highest adsorption of phenol and 4-CP. Fig. 5a shows the viable area of response values and the region that fits the optimum criteria is shaded in yellow. In this region, the removal percentages of phenol and 4-CP up to ranges of 47% to 49% and 88% to 93%, respectively, were achievable at the SAC dosage of 0.09 g and pH 7. This region was also further supported by the prediction desirability which was close to 1.0 (Fig. 5b), indicating maximum statistical desirability. Subsequently, an additional experimental run was performed accordingly and the results underscored the removals of phenol and 4-CP to the tune of 49% and 92%, which was in conformity with the predicted optimum condition.

Fig. 5 Overlay plot showing optimum region (shaded in yellow) (a) and their respective desirability plot (b) for a contact time of 24 h.
Wastewater loaded with multi-phenolic compounds is characteristically deleterious to the receiving water bodies if not treated sufficiently due to its intense toxicological effects. Henceforth, the simultaneous adsorption of phenolic compounds by using SAC was investigated in the present study. The CCD of RSM was exploited to optimize the interactive factors impinging the simultaneous adsorption of phenolic compounds to SAC. Correspondingly, the derived models of phenol and 4-CP removals were found to provide a satisfactory approximation to the real system, heralding statistical significance. The models also revealed that the contact time factor contributed the least effect on simultaneous adsorption process of phenol and 4-CP as compared with SAC dosage and pH of solution. Nevertheless, in all cases, the increase of pH dampened the effectiveness of adsorption process, though the SAC dosage and contact time responded reversely. Upon optimizing the interactive factors which transpired at the contact time of 24 h, SAC dosage of 0.09 g and pH of 7, the maximum adsorption capacities of phenol and 4-CP via experimental run were 49% and 92%, respectively, which were in agreement with the predicted values by CCD.
The financial supports from MyBrain 15 MyPhD and MyBrain 15 MyMaster are gratefully acknowledged.
Copyright © 2024 Research and Reviews, All Rights Reserved