
ISSN (0970-2083)
ISSN (0970-2083)
Scientist, CSIO, EMID, Sector 30, Chandigarh, India
Head, EMID, Secotr 30, Chandigarh, India
Visit for more related articles at Journal of Industrial Pollution Control
Due to heavy urbanization, industrilisation, population explosion and thereby deforestation , ambient noise has increased to intolerable level in most of the places. Therefore it has been immensely felt to monitor the noise intensity, its various parameters and quality to reduce it within permissible levels and further to meet the international standard. Through this paper while using :Real time sound analyzer”, a sincere effort has been made to understand the basic causes and features of noise to study its impact on human beings and community as a whole. The noise level data in terms f SPL, Leq, SEL, Ln, Dose, frequency and time weighting average has been computed to statistically calculate the noise effect in real time and actual sense. It is found that noise level data observes a normal distribution curve in residential area of Chandigarh and it will help us to develop appropriate mathematical model. In this paper various recommendation and suitable control have been suggested to reduce the impact of noise on human beings. At the end, a conclusion has been derived to standardize the noise monitoring procedures to cope up with international OSHA standard and threshold levels values (TLVS) of noise.
OSHA, Leq, SEL, SLM, statistical distribution, TWA
Sound is mechanical energy in the form of pressure variances in an elastic medium. These pressure variances (P) as waves propagate through a vibrating source makes changes in air pressure. This can be represented by waveform. Following is a graphic representation of a sound.
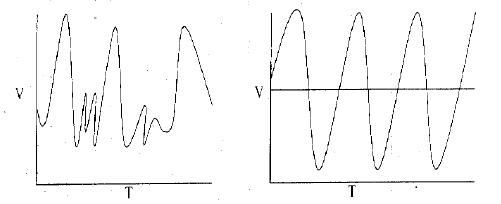
Audio frequency ranges from 20 Hz to 20 kHz. Any unwanted sound, which we don’t want to listen and has a very annoying effect on our ears, is noise. Some sound may be pleasant for one at the same time this may be noise to another person. Thus it can also be said to be a psychological phenomenon on individual.
There are basically three main elements of sound that is frequency, amplitude and time. A sound is generally a combination of different frequencies having same or different amplitudes. Amplitude is measured in dB (decibel) value. It maps the sound directly to the way that human perceive it. Decibel value is measured with respect to 20 - μ pascal reference sound pressure, which is threshold of audibility. Time also plays very important role when we calculate its effect on human beings. If our ear is exposed for a long time it may cause a fatal injury to us.
There are two types of noise (1) impulsive (2) continuous. Noise, which comes for a very short duration is called an impulsive noise. It is more hazardous than continuous noise because our ear is not habitual to this noise and has very severe effect on internal ear diaphragm. It has been reported that impulsive noise has 10 dB more impact compared to a continuous chronic noise (induced hearing triggering noise).
Induced hearing loss due to chronic Noise is a permanent sensorineural condition, which cannot be treated medically. It is characterized by declining sensitivity to high frequency sounds usually at frequencies above 2 kHz. Following are some major effects associated with it -
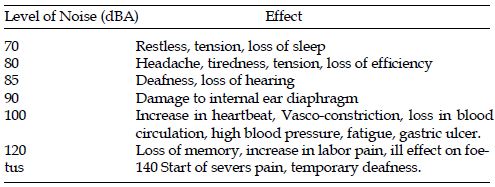
Eosinophilia, Hypocalcaemia (Diarrhoea, Starvation, Severe Vomiting, Liver Diseases, Chronic fever), Hyperglycemia, Hypoglycemia, Color blindness, defect in psychomotor system of body, are some of the major ailments due to noise pollution.
On the other hand exposure to a person with normal hearing in work places, noise at level equal to or exceeding SEL* (i.e. 90 dB according to OSHA**) may cause a shift. This is called a standard shift or threshed shift and is defined as a change, in hearing threshold of an average 10 dB or more at 2 KHz/ 3 KHz/ 4KHz in either ear.
Experimental Results - As per the prevailing standard prescribed by OSHA, WHO, and ICMR, (Indian council of Medical Research) sound noise is measures in 1/1 and 1/3 octave bands. In 1/1 and 1/3 octave bands center frequencies are given as below -

Table 1: Frequency Hz
In 1/1 octave band there are 11 center frequencies from 16 Hz to 16 KHz where as in 1/3 octave band we analyze data more precisely and there are 33 center frequencies as given in table- 1.
In A frequency- weighting network a gain of – 50 dB at 20 Hz is provided so that its response can match with the response to human ear. C weighting network is used for commercial area (fig 2.). A gain of –20 dB in B- Weighting and –7 at 20 C/s frequency is provided for the both weighting network. Bweighting network is preferentially used to measure instrumentation noise.
As explained above second weighting network is a time weighting network. There are three time weighting network that i.e. Slow, fast and impulsive. In slow weighting real time sound analyzer takes 1 second to display whereas in fast it takes 200 ms. In impulsive it responds instantaneously, most frequently and even at a rate lower than 200 ms.
Leq - It is the value of constant sound which would result in exposure to same total A – weighting energy as the specified time carrying sound, if constant level persisted for equal time interval. It is measures in dBA.
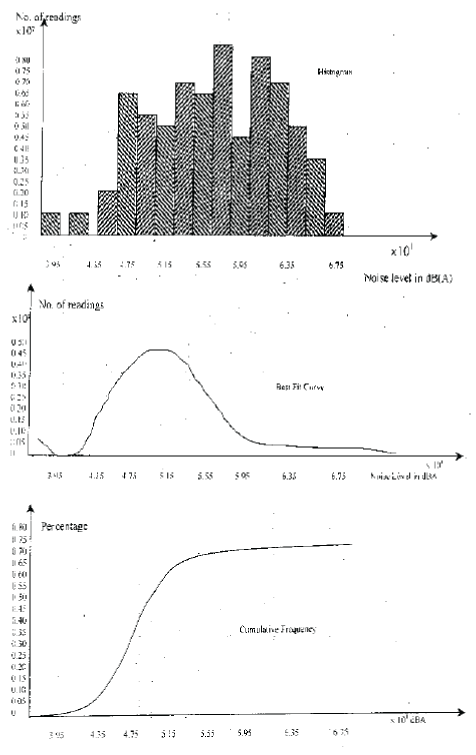
Ln - This is statistical parameter which indicates how frequently particular sound level is exceeded. (i.e. L40= 72 dBA means that 72 dBA was exceeded 40% of measuring time. To calculate Ln we have to first plot probability distribution curve and then cumulative distribution curve as shown below -
Statistical analysis of noise level in residential areas
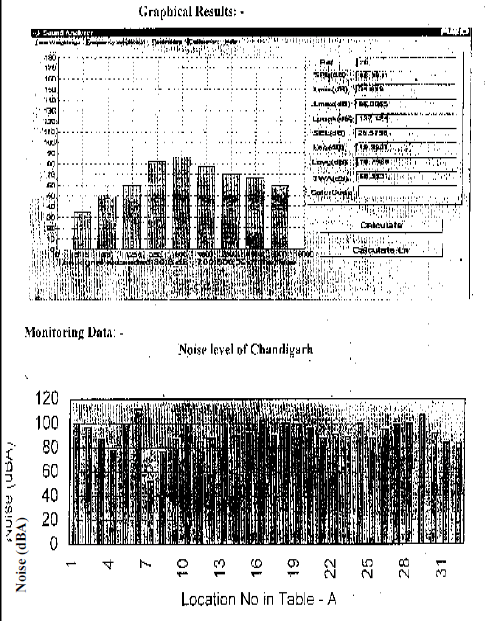
A histogram of the noise level readings obtained at each of about 170 monitoring points in the various sub sectors of each of the 47 residential sectors of Chandigarh has been prepared and is shown in the upper part of the figure. The histogram is plotted at intervals of 1 dB(A).
Lavg - This is the average sound level measured over run time while calculating it. Here averaging means not simply adding the levels and dividing by number of samples. While calculating the values Lavg, below a given threshed is taken as zero and only those values, which exceeds threshold accounts for Lavg. Suppose measurements is done for 1 hr and we set threshold level of 75 dB. During this run time if sound is between 45 dB and 70dB then Lavg is zero. If 75 dB was exceeded for only a few seconds during monitoring due to a plane passing over, then only those seconds will contribute to Lavg to a large extent. Lavg may become around 0 dB, lower than normal levels of 45 dB and 70dB in the present case.
Lmax- This is the highest sound level during the instrument run time, depending upon frequency and time weighting.
SEL - (sound exposure level)- This averages the sound for one second time period. Assuming the samples time> second, it should be averaged over the time period for which it was recorded, samples and finally brought down to 1 second energy.
To calculate the above parameters and know decibel values of each frequency component (i.e. bands) we plot the data on graph. We have also developed Algorithm and software using DSP (ADSP 2105) for real time sound analysis.
Noise survey and monitoring
>>We have collected data using the standard LARSON- DAVIS Real time sound analyzer (Model 824 Se. No: 824 A 1589) from two different sources. In 1st case a train passes taking 10 minutes with Leq- 82 dBA. In 2nd case jet passes overhead taking 45 seconds with Leq = 96 dBA. To know which noise is more hazardous, we calculate the SEL of their respective values.
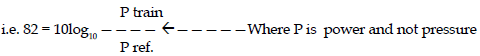
P Train = 108.2 P ref. Energy - Ptrain x 10 min. = 10 8.2 x 600 Pref. SEL Tram= 10 log 10 x 108.2 x 600 = 109.7 dBA Similarly SEL plane = 112.5 dBA.
Initially it seems that noise of train has exposed an individual for 600 seconds and that of plane for 45 seconds so, noise of train is more hazardous but from their calculated SEL values it becomes crystal clear that noise of plane occurred only for 45 seconds but has high impact on human ears.
Short abbreviations
R.A. - Round about P.G.I. - Post graduate institute of medical research PWSSB - Public work station south block H.B.Chowk - Housing board chowk
Observation/ Suggestion
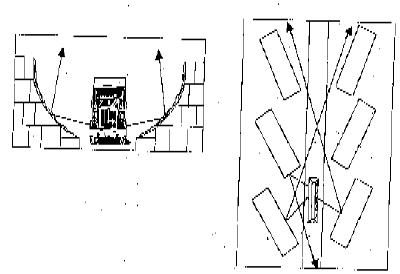
We have observed that everywhere in Chandigarh noise is beyond permissible limit including residential area. Even in hospital that is in PGI it is beyond the specified limit of 45 dBA prescribed by CPCB (Central Pollution Control It is mainly due to overpopulation and increased vehicular density. The city beautiful was originally designed for 2 lackh peoples by French Architect, Le Carbusoer. Today the population of Chandigarh has increased to around 9.25 lakh thus an increase by five fold. This is one of the reasons for increase in noise pollution. Another significant reason for increase in sound pollution is due to rise in vehicular density. In Chandigarh this rise has been found in Arithmetic Progression. Everyday 200 to 300 new vehicles are registered in Chandigarh and has been creating an alarming situation. For controlling this pollution there should be heavy plantation around the road. We have noticed some scientific result under our research programme; the same has been depicted in (fig- 3) graph given below. Here we have monitored noise with and without plantation density with reference to increase in distance form highway side. It is observed that at a distance of 100 ft after road, noise decreases drastically due to plantation. So plantation of ashoka and peepal should be done 100 ft away from road. The types of trees and its density varies from place to place and also as per the geography of place . Position of building should be such that there is no echo from the front face of buildings.
Geometry of buildings for noise minimisation
There is certain limit beyond which efficiency of working person decreases drastically. This limit is known as Dose. In industrial complexes combined effect of 85 dBA for 8 hours at a frequency 4 kHz is called one Dose. Table- 3 depicts the OSHA Dose so there should be an instrument like Dosimeter, which can be kept in the pocket of a worker. If the value of Dosimeter exceeds a prescribed limit, the alarm gets on then worker must be given rest from work and relief there after.
In coming days a need for adaptive noise system has been being immensely felt. This can be achieved through electro acoustical means. In active sound cancellation, a controlled sound source creates sound in a selected region and (as per OSHA, 2003)

Table - A City noise
In adaptive sound cancellation, active sound cancellation is maintained in presence of changes in the real situation. Sound control includes sound reduction by cancellation and equalization. There are lot of future scopes in this field to tackle such problems and we are planning to work on them.
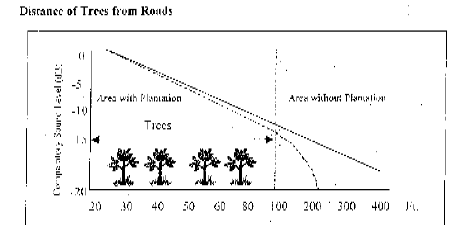

Table- 3
The authors are thankful to Dr. R.P. Bajpai, Director, CSIO for his encouragement and co-ordination and Dr. J.K. Sharma. Advisor IDP, DST, New Delhi to fund this programme and publish this paper. Thanks are also due to Shri. Amod Kumar for technical discussion and Shri Mohan Kuamr for secretarial assistance.
Copyright © 2026 Research and Reviews, All Rights Reserved