
ISSN (0970-2083)
ISSN (0970-2083)
Department of Chemical and Petroleum Engineering University of Uyo, P.M.B. 1017, UYO Akwa Ibom State, Nigeria
Visit for more related articles at Journal of Industrial Pollution Control
The concentration of chromium and lead ions in the effluent discharge from high pressure synthesis loop in a nitrogenous fertilizer plant has been investigated using the symadzu 160UV, visible/ultraviolet light of 2cm model photo spectrometer at room temperature .The extraction methods were adopted in the analysis of samples collected from six points. The determination of Cr (0.001-0.65) Mg and of Pb (0.001-75) Mg in water in the presence of interfering ions such as Ni, Mo, Co, Fe, Zn, Al, Mg, Bi, Cu, As etc were done. Analysis base on chemical formula produce results, which were plotted as concentration against time and contrasted with standard recommendation. The results are in good agreement. The application of the findings is many, particular, in heavy metal monitoring and controls production optimization and wastewater management system wherein aquatic lives and the health of human are important.
Chromium and lead ions, Effluent discharge, Spectrophotometer
The Significance of spectrophotometric determination of Chromium (Cr2-) and lead (Pbzt) ions in effluent discharge from the high-pressure synthesis loop of a fertilizer plant is hinged on health and environment reasons. The cumulative effect and toxic implication of these heavy metals on aquatic and human lives and the overall environmental pollution hazards are enormous (Greenberg and Kingston, 1989). Chromium form the bulk urea grade alloys (2Cr Ni Mo) used in most high-pressure vessels in the chemical plant ( Kellogg 1985), and its contaminated water causes asthma, ulcer, dermatitis and perforation of nasal septum (Mani 2005). On the other hand metallic Lead constitutes the bulk of most galvanize pipes, welding electrodes and paint pigments (red lead oxide paints). Used in coating in the plant (Neeka, 2003). The event of corrosion releases these toxic ions through effluent waters into the environment. Though both Cr2+ and Pb2+ have cumulative poisonous effect on human and aquatic lives (ASTM, 1976) spectrophotometry provides effective analytical technique of accurate concentration in waste water from the chemical plant, and time resolve measurement has shown that cumulative increase in Cr and Pb increases with the rate of corrosion in the heat exchanger tubes, the purity level of deminerized water from the cooling water plant and the process variables conditions (Washington, 1991). The present study attempts to marks several other heavy metals and examine the relationship between time and cumulative formation of Cr2+ and Pb2+ with reference to the Federal Environmental Protection Agency (FEPA) tolerance limit. The extraction procedure follows the standard of American Industrial Environment guidelines as reported in ( ATAMA et al. 2005) with good correlation.
Apparatus
The essential apparatus included symadzu 160 UV, 2 cm model spectrophotometer with scanning system for monitoring the ultraviolet and visible region emission from the heated effluent solution, volumetric flask, beakers, burette, pH meter, glass stopper and sample cans.

Table 1: Average Spectrophotometric reading for chromium at 440nm wavelength

Table 2: Average Spectrophotometric reading for lead at 520nm wavelength

Table 3: ASTM tolerance concentration for heavy metal (ppm)

Table 4: Spectrophotometric reading for chromium at 440nm wavelength

Table 5: Spectrophotometric reading of lead at 520nm wavelength
Reagents
The following reagents in accurate concentration were used; potassium sulphate, potassium hypoiodite, silver nitrate, tetraoxosulphate (vi) acid, potassium cyanide, (KCN), Ammonia (NH3), Sodium tartrate solution, carbon tetrachloride (CCL4) solution, Thymol blue, Dithiozoue indicators, concentrated trioxonitrate (v) acid (HNO3) solution.
Sample collection
The samples used in these analyses were collected from six points once every where for five weeks using six white 10 liter cans. The cans were sterilized by washing it with hot water, warm mild detergent solution, rinsing with distilled water followed by drying by turning the cans upside down for 2 days.

Fig. 1 Average variation of chromium concentration time graph at 440nm wavelength

Fig. 2 Average variation in concentration time graph at 520 nm wavelength

Fig. 3 Semilog plot of concentration time graph of lead ion 530 nm wavelength

Fig. 4 Concentration time graph of chromium at 440 nm wavelength

Fig. 5 Concentration time graph at 520 nm wavelength
Sample preparation
A standard solution from 0.15g of potassium chromate was prepared 250mL of water. The following reagents were added:
5-6 drops of 10% Ag No3 solution, 25cm3 of 0.1MK104 solution, 0.5cm3 of 10% H2504 solution.
The solution was made up to 100cm3 volume. The solution was extracted into another 250ml beaker and made up to 100cm3 by adding distilled water. The extract was properly shaken and allowed to stand for 5mins and then added 5-6 drops of 10% H2504, 0.1m AgNO3 solution, 1g of 10% K2 S2504, solution. The mixture was gently heated to boiling point for about 5mins, cooled to room temperature and 0.5g of 10% K104 also added before final heating to boil for 5mins. The solution was extracted into another 250mL beaker and made up to 100cm3 volumes and the absorbance read up at 440nm wavelength in the symadzu 160UV spectrophotometer.
Similarly, the extraction method for lead ion in solution was prepared by adding 5-6 drops of concentrated HNO3 solution, shaken properly and allowed to stand for 2 days. Then the acidified solution was poured into a reparatory cup rotating at 500turn per second and filtered. Into the filtrate, 2-3 drops of concentrated HNO3 solution was added to lower the pH to about 2.0 and then transferred 100cm3 of the filtrate into a separating funnel and added the following; 5-6 drops of thymol blue indicator, 25cm3 of 20% NH3 solution and 5cm3 of 0.2m dithiozone. The solution was properly shaken and allowed to stand for 2mins. More dithiozone solution added and the layers filtered. The filtrate collected was put into a separating funnel and 5cm3 of 2M CCL4 added into the second layer and extracted. To the extracts collected into the second reparatory funnel were added 20cm3 of alkaline KCN solution and shaken properly. The CCL4 were drained in to the second separatory funnel into a 5cm3 volumetric flask and the extraction continued for six times and each time, adding 2cm3 of 2M CCL4 of the solvent used in eluting the aqueous phase. Volumetric flask and make up to the mark by adding more CCL4 solution. The CCL4 solution serves as reference material. The solution was filtered through a dry filter paper and the absorbance read up in the spectrophotometer irradiating light at 2cm of wavelength 520nm at room temperature.
Rate reaction equation
The process kinetics governing the reaction of chromium and lead ions in solution has been thoroughly investigated by Neeka (2003). The molecular interaction between soluble chromium and slightly soluble lead create strong chelated complexes according to the equations.
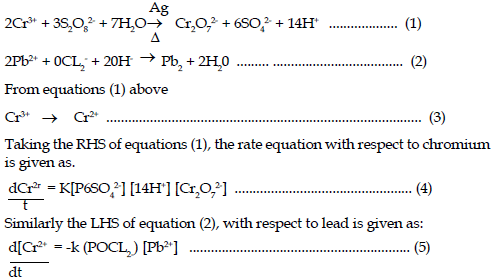
Equation (4) is first order rate equation and (5) is second order with respect to hydroxyl ion. The basic assumption in both cases is that the pH concentration of effluent discharge is known. The partial pressure of the sulphate and hypochloride ions and other known parameters are lump together and the rate reaction constant equation reduces to first order kinetics thus:
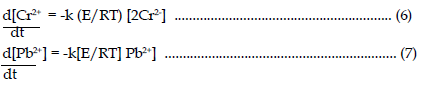
Where E is the molar absorption coefficient, R is the Molar gas constant at absolute temperature T. Integrating both side of equations (6) and (7) to conform to Beer’s Lambert equation yields;
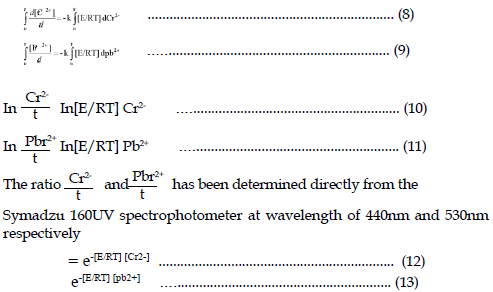
The equations (12) and (13) are the derived forms of Beer’s Lambert equation for absorption coefficient of any given substance at any given wavelength. These equations are evaluated by plotting

Both chromium (Cr2-) and lead (Pb2+) are heavy metals that need to be reduced considerably from the effluent water for health and environmental reasons. The urea plant high-pressure vessels have specified urea grade metal alloys 2 CrNiMo for which chromium erode into effluent wastewater during corrosion. Similarly other paints and particularly the red lead oxide of zinc chromate used for drying of process condensate lines releases lead ion to the effluent water during corrosion, specialize as the plant is aging. By this process, it becomes absolutely necessary to adopt the spectrophotometric method in analyzing the concentration of chromium and lead in wastewater discharge. The extraction methods were adopted in both cases. Rigorous masking and extraction steps taken reduce this inference and impurity levels of mg, Ni, Bi, Cu, Mo, As etc. The result agrees with the work of Greenberg and George Washington. The wavelength at which considerable absorption of chromium could be noticed varies within 440-450 nm and that of lead is precise at 530nm. The results in both cases show an increase above the tolerance level. The American standard for testing material (ASTM) and World health organization (W.H.O) specified 0.02 and 0.05 tolerance doses respectively. The results show increases up to the tolerance level and tend to remain slightly above it. These results agree with the report of Atama et al. (2005). It is obvious that the effect of corrosion directly influences the level of concentration of these heavy metals in wastewater. The purity level of the results is high and the absorbance level at the visible and ultraviolet region, adequate at a higher wavelength of 440nm and 520nm respectively. Studies at higher wavelength region indicate that this work could adequately explain the level of chromium and lead ions in effluent wastewater discharged from the high-pressure synthesis loop. Caution must be exercised to carry out the analysis at room temperature by allowing the sample to cool before preparation for analysis.
Both chromium and lead have cumulative poisonous effect on human and aquatic lives and needs to be minimized considerably. The cost of control may vary proportionately with corrosion maintenance but the end result on safe and healthy living need not be compromised. The early checks on corrosion rate increase should be adopted as the plant is aging. There should be alternatives to lead fill paints and other coating agents on process pipes. Subject to variation in analysis methods, it can be seen that at higher wavelength; the peak band also varies in compliance with Beer Lambart’s theory of absorptive coefficient. It is strongly proposed that there should be proper and inadequate wastewater treatment before discharge. Chromium and lead concentration in effluent discharge from the high-pressure synthesis loop are considerably high.
Nomenclature
DPW – Demineralized plant drain point water
CCA – Carbamate condenser drain point water
RTC – Reactor drain point C
SBD – Scrubber drain point D
SPB – Stripper drain point B
STE – Sump tank, effluent.
NAFCON-National Fertilizer Company of Nigeria Limited.
We wish to sincerely acknowledge the contributions of Engr. Tony Ikhabohme, urea plant superintendent (NAFCON) for allowing us access to the plant site, Mr Lebari Kabel, shift A superintendent (NAFCON) for assisting us in setting and running the tests with sydmatu 160 spectrophotomer and Dr. Steve Amadi, Head of Department chemical/petrochemical engineering, Rivers State University of Science and Technology Port Harcourt, Nigeria for his courage and financial support in carrying out the study.
Copyright © 2025 Research and Reviews, All Rights Reserved