
ISSN (0970-2083)
ISSN (0970-2083)
Karthiga S1, Tamilselvan K2* and Pavithra C1
1Assistant Professors (O.G), Department of Civil Engineering, SRM University, Kattankulathur Campus, India-603203
2Post Graduate student, M. Tech Structural Engineering, SRM University, Kattankulathur Campus, India-603203
Received 11 July, 2017; Accepted 24 October, 2017
Visit for more related articles at Journal of Industrial Pollution Control
Buildings with irregularities are unavoidable in the current scenario and these irregularities cause serious damage to the structure during earthquake. The analysis and design of buildings with these irregularities is time consuming. The present study aims to compare the performance of Force Based Design (FBD) and Displacement Design Based Design (DDBD) for buildings with Vertical geometric irregularity and Mass irregularity of two dimensional reinforced concrete frames of four, eight and twelve stories. The performance of these two design procedures were compared using the structural parameters like Interstorey drift and Ductility demand. The results were in favour of DDBD as it helps in achieving better performance.
Force based design, Direct displacement based design, Vertical geometric irregular, Mass irregular, Ductility demand, Interstorey drift
An Earthquake is a destructive force which causes serious damage to the buildings and human life; hence the buildings should be designed for seismic forces. Damage to the structures can be determined effectively by displacement rather than by forces. The current Force Based Design (FBD) method as per (IS 1893 (Part 1), 2002) is predominantly based on the minimum strength required for the structure. But there are many significant problems with this procedure such as a) determination of response reduction factor, b) assumed stiffness, c) time period calculation and determination of ductility (Priestly, et al., 2007). Hence, the Direct Displacement Based Design (DDBD) was adopted in which the structures were designed for peak displacement response rather than the elastic properties like stiffness and damping as in the Force Based Design. Damage to the structural systems occurs mainly due to material strain (Structural effects) and drift (Nonstructural effects). Hence, the displacement profile is determined based on 1. Limit material strain and 2. Code specified drift limits (Priestly and Kowalsky, 2000). To achieve the damage control limit state, the drift limit of 0.025 was taken and the design procedure was carried out. The design procedure for DDBD was performed as per priestly methods. In this present study, comparison of two design procedures was done for two dimensional (2D) reinforced concrete frames and its performance was evaluated (Moehle, et al., 1986; FEMA 356, 2000).
Regular and irregular two Dimensional (2D) reinforced concrete frames of height 12 m (4 storey), 24 m (8 storey) and 36 m (12 storey) were studied using Structural Analysis Program SAP 2000 version 14. All the frames were of uniform storey height of 3 m and bay width of 6 m. The dead load and live load on each storey were its self weight and the live load corresponding to industrial buildings as per (IS 875 (Part-2), 1987).
The frames were designed for seismic zone III of medium soil and 5% damping was assumed as per (IS 1893 (Part-2), 2002). M25 and Fe 415 were the grade of concrete and steel used. The irregular frames were selected such that they satisfy the irregularity condition as per (IS: 1893-part-1, 2002) clause 7.1. The dimensions of the beams and columns of the frames used in the study are shown below in Table 1.
| No. of stories | Regular and vertical geometric irregular frames | Mass irregular frames | ||
|---|---|---|---|---|
| Beam sections (mm) |
Column sections (mm) | Beam sections (mm) |
Column sections (mm) | |
| 4 | 450 × 230 | 400 × 400 | 450 × 230 | 400 × 400 |
| 8 | 450 × 230 | 500 × 500 | 450 × 230 | 500 × 500 (5-8) |
| 500 × 300* | 600 × 600 (1-4) | |||
| 12 | 450 × 230 | 500 × 500 | 450 × 230 | 500 × 500 (7-12) |
| 500 × 300* | 600 × 600 (1-6) | |||
Table 1: Dimension of beams and columns
The column base was modelled as fixed support. The joints in the frames were modelled by giving end-offsets length and were considered to be rigid. Beams and columns were designed for flexural hinges as per (FEMA 356, 2000). The performance of the frames designed using FBD was analysed by Non-Linear Time History Analysis. (Figure 1) shows the irregular reinforced concrete frames used in the present study. (Figure 2) shows the response spectra for seven ground motions and the target spectra of 0.32 g as the smoothened curve and the target response spectra of these seven ground motions are similar to the smoothened spectra of 0.32 g and hence these ground motions were used in the present study.

Figure 1: Irregular reinforced concrete frames.

Figure 2: Response spectra for 0.32 g ground motions.
The study involved analysis and design of 2D regular (4R, 8R and 12R), vertical geometric irregularity (4VI, 8VI and 12VI) and mass irregular frames (4MI, 8MI and 12MI) of four, eight and twelve stories and the performance of the frames designed using FBD and DDBD was evaluated by comparing the parameters such as Interstorey Drift and Ductility Demand. The results are shown below (Aidcer and Kowalsky, 2013; Muljatia, et al., 2015; Alefiya, et al., 2014; Himanshu and Gagandeeo, 2014).
Interstorey drift
The relative displacement between two consecutive storeys is termed as interstorey drift and is determined from difference in the displacement values of successive floors to the storey height. Damages can be better understood from deformations of structure. Hence to calculate the performance of the structure interstorey Drift is used as the parameter.
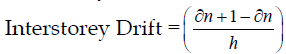
Where, ∂n+1 = Displacement at n+1 storey
∂n = Displacement at n storey
h = Storey height
The Interstorey drift values of four, eight and twelve storeys for regular, vertical geometric irregular and mass irregular 2D frames are shown in below (Figure 3a-3i).

Figure 3 a): Interstorey Drift values for 4R frames, b) Interstorey Drift values for 8R frames c) Interstorey Drift values for 12R frames, d) Interstorey Drift values for 4VI frames, e) Interstorey Drift values for 8VI frames, f) Interstorey Drift values for 12VI frames, g) Interstorey Drift values for 4MI frames, h) Interstorey Drift values for 8MI frames (8MI), i) Interstorey Drift values for 12MI frames.
From above figures it’s clear that regular frames tend to be elastic in upper and lower stories while the vertical geometric irregular and mass irregular frames tend to be inelastic in upper stories as they experience higher interstorey drift values due to the irregularities. Mass irregular frame experienced higher interstorey drift values in the floors where mass irregularities were considered (Qiang and Cheng-Chung, 2003; Medhekar and Kennedy, 2000).
The geomean values of interstorey Drift were compared for Regular, Vertical geometric irregular and Mass irregular frames for four, eight and twelve stories and are shown in below (Figure 4a-4c).

Figure 4 a): Geomean Interstorey drift values for four storeys, b) Geomean Interstorey drift values for eight storeys, c) Geomean Interstorey drift values for twelve storeys.
The above figures explains that for four storey mass irregular and regular frames experiences approximately equal interstorey drift values while the vertical geometric irregular frames experiences 36.2% lower interstorey drift values than the regular frames in intermediate stories. For eight stories, mass and vertical geometric irregular frames experiences 75% and 60.7% higher interstorey drift values than the regular frames in upper stories while at bottom stories mass irregular frames experiences 53.7% higher interstorey drift values and vertical geometric irregular frames experiences 22.7% lower interstorey drift values than the regular frames and for 12 storeys mass and vertical geometric irregular frames experiences 84.74% and 79% higher interstorey drift values than the regular frames at upper stories while at bottom stories mass irregular frames experiences 69.6% higher interstorey drift values and vertical geometric irregular frames experiences 8.06% lower interstorey drift values than the regular frames.
The comparison of interstorey Drift values between FBD and DDBD of regular, vertical geometric irregular and mass irregular frames are shown below in the Table 2. The interstorey drift values for FBD were calculated from the geomean values of all the stories.
| No of stories | Regular | Vertical geometric irregular | Mass irregular | |||
|---|---|---|---|---|---|---|
| FBD | DDBD | FBD | DDBD | FBD | DDBD | |
| 4 | 0.0061 | 0.025 | 0.0044 | 0.025 | 0.00643 | 0.025 |
| 8 | 0.0063 | 0.025 | 0.0073 | 0.025 | 0.0155 | 0.025 |
| 12 | 0.0042 | 0.025 | 0.0064 | 0.025 | 0.0134 | 0.025 |
Table 2: Interstorey drift values of regular frames
The above Table 2 explains that the interstorey Drift values of DDBD was 75.6%, 74.85 and 83.2% higher than the FBD for 4R, 8R and 12R frames while the Interstorey drift values of DDBD was 82.4%, 70.8% and 74.4% higher than FBD for 4VI, 8VI and 12VI frames and the interstorey drift values of DDBD was 74.4%, 38% and 46.4% higher than FBD for mass irregular frames because the FBD tends to behave in a rigid manner while in DDBD drift limit were chosen such that they behave flexible in nature.
Ductility demand
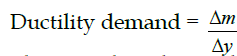
The ability of the material to undergo large inelastic deformation is termed as Ductility. Ductility demand is calculated by dividing the maximum displacement by the yield displacement of the structure. If the building is more ductile, they can withstand large forces. Hence to measure the performance of the structure Ductility demand is used.
The Ductility demand values of four, eight and twelve stories for regular, vertical geometric irregular and mass irregular 2D frames are shown in below (Figure 5a-5i).

Figure 5 a): Ductility demand values for 4R frames, b) Ductility demand values for 8R frames c) Ductility demand values for 12R frames, d) Ductility demand values for 4VI frames, e) Ductility demand values for 8VI frames, f) Ductility demand values for 12VI frames, g) Ductility demand values for 4MI frames, h) Ductility demand values for 8MI frames (8MI), i) Ductility demand values for 12MI frames.
From above figures it’s clear that the Ductility demand of lower stories were high because the lower stories were rigid due to the fixed support which was clear from the less displacement value when compared to the upper stories. In general Ductility demand decreases as the storey height increases except in 12VI and 8MI frames where Ductility demand increases as the storey increases.
The geomean values of Ductility demand were compared for Regular, Vertical geometric irregular and mass irregular frames of four, eight and twelve stories and are shown in below (Figure 6a-6c).

Figure 6 a): Geomean ductility demand values for four storeys, b) Geomean ductility demand values for eight storeys, c) Geomean ductility demand values for twelve storeys.
The above figures explains that for 4 storeys, ductility demand of vertical geometric and mass irregular frames were 36.63% and 11.35% lower than the regular frames in bottom stories while at upper stories vertical geometric irregular frames and regular frames were approximately equal and mass irregular frames were 54.42% lower than the regular frames. For 8 stories, vertical geometric irregular frames were 25.38% lower than regular frames in bottom stories while at upper stories vertical geometric irregular frames were 36.79% higher than the regular frames due to their inelastic behaviour and for mass irregular frames ductility demand values were 76.24% and 22.49% lower than the regular frames in bottom and upper stories. For 12 stories, vertical geometric irregular frames were 3.62% lower than regular frames in bottom stories while at upper stories vertical geometric irregular frames were 34.14% higher than the regular frames due to their inelastic behaviour and for mass irregular frames ductility demand values were 55.85% and 44.64% lower than the regular frames in bottom and upper stories Table 3.
| No of stories | Regular | Vertical geometric irregular | Mass irregular | |||
|---|---|---|---|---|---|---|
| FBD | DDBD | FBD | DDBD | FBD | DDBD | |
| 4 | 4.24 | 1.64 | 3.44 | 1.65 | 3.45 | 1.64 |
| 8 | 4.07 | 1.37 | 3.86 | 1.43 | 1.55 | 1.36 |
| 12 | 2.92 | 1.36 | 2.92 | 1.40 | 1.43 | 1.34 |
Table 3: The ductility demand values for force based design were calculated from the geomean values of all the storey values.
From above Table it’s evident that the ductility demand of DDBD was 61.32%, 66.34% and 53.42% lower than the FBD for 4R, 8R and 12R frames, while the Ductility demand of DDBD was 52.03%, 62.95% and 52.05% lower than the FBD for 4VI, 8VI and 12VI frames and the Ductility demand of DDBD was 52.46%, 12.2% and 6.2% lower than the 4MI, 8MI and 12MI frames which indicates that DDBD is more ductile, because the design procedure involves the use of limit material strain and damage control drift limit at the initial process.
Direct Displacement Based Design procedure is simple in its approach, less time consuming and it helps in achieving better performance. In contrast, the Force Based Design requires several iterations of design procedure to achieve better performance of the structure.
The following results were obtained from this study,
a) Interstorey drift values of mass irregular frames were higher than the regular frames for four, eight and twelve stories due to the provision of extra mass which cause higher displacement in mass irregular frames, while for vertical geometric irregular frames it was lesser than regular frames in lower stories, as the storey height increases the vertical geometric irregular frames were higher than regular frames due to the excessive deformation of the upper stories as they behave inelastic due to the irregularities. Interstorey drift values for DDBD were higher than FBD for regular, vertical geometric irregular and mass irregular frames, as its design procedure is to achieve the proposed drift limit.
b) Ductility demand for mass irregular frames was lower than the regular frames for four, eight and twelve stories. Ductility demand values of vertical geometric irregular frames were lower than the regular frames for four, eight and twelve stories in lower stories due to their inability to make use of its reserved ductility because of shift in damage concentration towards bottom stories while the ductility demand values of vertical geometric irregular frames were higher than the regular frames in upper stories due to their inelastic behaviour. Ductility demand values of DDBD were lower than the FBD for regular and vertical geometric irregular and mass irregular frames, because the design procedure involves the use of limit material strain and damage control drift limit at the initial process.
The present study figures out that DDBD is better in achieving structural performance than the FBD, while comparing vertical geometric irregular and mass irregular frames, the mass irregular frames experiences higher interstorey drift while the ductility demand of vertical geometric irregular frames were higher in upper stories. Vertical geometric and mass irregular frames tend to behave more in an inelastic manner in upper stories due to the irregularities.
Copyright © 2026 Research and Reviews, All Rights Reserved