
ISSN (0970-2083)
ISSN (0970-2083)
Mechanical Engineering Department, School of Engineering, Australian College of Kuwait, Kuwait
Received 03 December, 2018; Accepted 26 December, 2018
Visit for more related articles at Journal of Industrial Pollution Control
Renewable Energy Hybrid System (REHS) is a system that utilizes two sources or more of renewable energy. As an advantage, it will assist in producing continuous sources of energy and utilizing one source in the absence of other source(s). The aim of this research is to enhance the energy output of renewable energy system which is the wind turbine by incorporating solar panels. Other objective is to investigate the effect of solar panels distribution on the total power output of the new created hybrid system by investigating two cases. First, by using one large solar panel that is connected to the hybrid controller with the wind turbine. Second, by using smaller size solar panels that have an equivalent area to the panel used in the first case. Results showed that the power output of the wind turbine is improved when connected to the solar panel, and a continuous power output is achieved. One big solar panel has better effect in improving the power output than using smaller size solar panels.
Renewable energy, Wind turbine, Solar panels, Hybrid systems
The main types of energy sources, are the fossil fuels and the renewable ones. The fossil fuel type has a finite life and endure risks of environmental degradation and contribution to global warming. Renewable energies can be from several sources such as the geothermal, tidal, solar, wind, and biomass (Assad, et al., 2017; Assad, et al., 2016; Lilliestam and Pitz-Paal, 2018; Evans, et al., 2018; Bani-Hani, 2017). Therefore, it is important to develop the current renewable energy sources (RES). Where a noticeable positive environmental effects such as reduction in the toxic emissions and being affordable in comparison with fossil fuel power plants (Marchenko and Solomin, 2010; Marchenko and Solomin, 2013; Marchenko and Solomin, 2014; Lombardi, et al., 2016; Marchenko and Solomin, 2015).
Hybrid energy system refers to the integration of two or more sources of energy that are combined to form one continuous and reliable power supply power output (Ngan and Tan, 2012; Paska, 2009; Juan, et al., 2010). One example of such a system is the solar-wind hybrid system (Nema, et al., 2010; Ekren and Ekren, 2008) that benefits from two sources of renewable energy which are the wind and the solar energy. The combination of wind and solar energies is the alternative source to produce clean and non-polluted continuous energy. The system is suitable for countries like Kuwait where wind energy is not totally reliable (Sebzali, et al., 2013) where non-continuous high wind speed along the year is recorded. On the other hand, Kuwait has high solar radiation throughout the year where the solar panels are beneficial in extracting the solar energy. Thus, the hybrid system takes advantage from two sources of energy at the same time. Furthermore, in the absence of one of the sources the system shall continue to supply energy.
Previous study on hybrid combination system of renewable energy sources showed that electricity has high cost because of the centralized energy system that operates on fossil fuel, and it needs huge investments to establish transmissions and distribute the grids that penetrate remote areas (Unune and Mali, 2014). On the other hand, the decentralized energy systems which are based on renewable energy sources operate at lower kWh scale in both absence and presence of grids. In addition, decentralized energy systems have easy access to remote regions because of the power generation in the similarity of demand site.
Literature (Ekren and Ekren, 2009) mentioned that wind and solar energies mostly available for remote regions as renewable energy sources. However, neither a standalone wind energy nor a solar energy system can produce continuous energy supply due to periodical and seasonal variations. Thus, multiple energy resources simultaneous utilization (Hybrid Energy Systems) improves the surety of meeting demand. Wind and solar energies have been used widely as a hybrid energy system for electricity supply due to their excellent complementary of each other as energy sources.
Erlier researchers (Panwar, et al., 2011) conducted a study regarding hybrid energy systems proved that renewable energy technologies reduced negative impacts of the environment, produced minimum wastes, and provide clean and sustainable world.
A Study of battery units performance in hybrid energy system at different temperatures was conducted by considering SOV (state of voltage) instead of SOC (state of charge) (Morgan, et al., 1997). The algorithms used in the study predicted the hybrid energy system performance at several battery temperatures. The performed study is important for hybrid energy system efficiency, and it showed that temperature affects the PV array and battery unit performance.
An analysis of hybrid energy system usability was done by using simulations to optimize the electricity generated by the system (Agustín and López, 2009). It showed that standalone hybrid energy systems are more suitable than only wind system or photovoltaic in terms of higher reliability and lower cost. However, optimization, and control of the hybrid systems are usually complex due to the high variables number and non-linearity.
Solar tracking system as one of the development in the solar energy systems is widely used to improve the performance of solar panels (Sedaghat, et al., 2018). Solar tracking system is used for large grid-connected PV (Photovoltaic) plants to increase solar radiations collection and to reduce the delivered electricity cost. A research regarding solar tracker system mentioned that PV power output reaches the maximum when the sun is at 90° (its highest point). In addition, solar tracker system allows PV modules to change their orientation tracking sun position by fitting them with a mechanical device instead of the fixed PV modules (Khadidja, et al., 2014; Ashish and Rakhonde, 2015).
The aim of this research can be summarized in experimentally investigating the effect of combining two different renewable energy sources in one system which is called the hybrid system. Showing the different components and power output of solar –wind hybrid system under different environmental conditions. This research is also showing a comparison between the efficiency of the hybrid system among the two separated renewable energy sources which makes it suitable for many applications and not only for small communities (Bandoc, et al., 2016). This research investigates the performance of the hybrid system under different system conditions, where, the solar panel is replaced by smaller solar panels with equivalent area distributed in different orientation to maximize the solar incidence on the area.
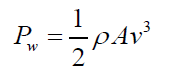
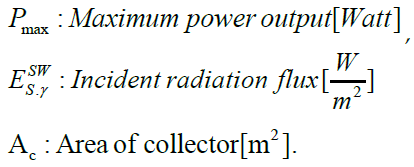
This research compares the performance of wind-solar hybrid energy system to the performance of solar panels and wind turbines as individual renewable energy systems. A three blades wind turbine is used. The calculations on the power (output/input), and the efficiency of both wind turbine and solar panel systems are according to Kuwait data. The power stored in the wind is given by Eq. (1):
 (1)
(1)
Where:
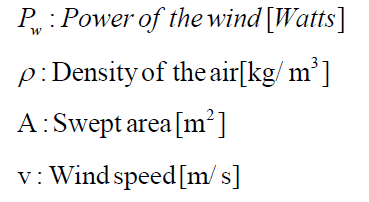
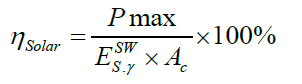
The Efficiency of the wind turbine is shown in Eq. (2)
 (2)
(2)
Where:
η: Efficiency [%], Poutput: Power output [Watt], and Pinput: Power input [Watt].
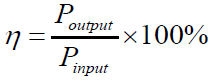
The solar panels used in this research are monocrystalline but with different dimensions so as to distribute the area among different orientations to get more solar radiation. Smaller solar panels (16 × 24 cm) have the same total area of one big size solar panel (35 × 62.5 cm) providing the same power output. The idea behind this is not to use solar tracking system and make the solar panels exposed more to the solar irradiation. Which means 6 small size solar panels with the same specification like the bigger one.
Where the efficiency is define in Eq. (3):
 (3)
(3)
Where:
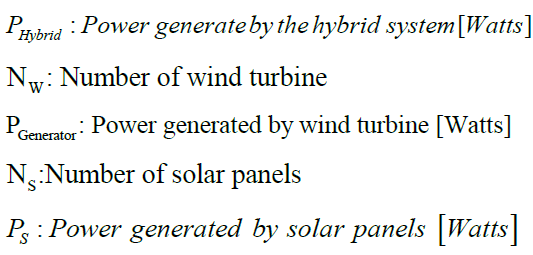
The same specifications of the three blades wind turbine and the solar panels are used to create the hybrid renewable energy system that will be investigated. The total power output of the hybrid energy system is given by Eq.(4).
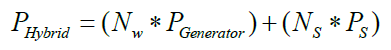 (4)
(4)
Where
The wind turbine alone is tested and the power output is calculated, (Fig. 1) shows the three blades wind turbine used.

Fig. 1: Three blades wind turbine specifications, all dimensions are in mm.
The solar energy output is tested by using first a one big solar panel, then by using 6 smaller size solar panels of equivalent specifications. The efficiency of each system is calculated. The hybrid system is tested by connecting the wind turbine first to the single solar panel, then to the six smaller solar panels. Again the efficiency is calculated for each arrangement for comparison.
The solar-wind hybrid controller plays a significant role in producing energy from two different renewable energy systems called solar panel and the wind turbine to one output (Fig. 2 and 3) This controller that combines solar and wind energy, will be connected to a rechargeable battery to store the energy. The other function of this controller is to avoid and protect the system from high or fluctuating voltage and it has the ability to protect the battery from over charging and increase the life of the battery.
The efficiency of the renewable energy hybrid system is given by Eq.(5)
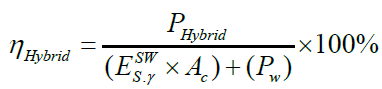 (5)
(5)
Where:
Both solar panel and the wind turbine are arranged in two different methods. In (Fig. 2), the wind turbine is connected to the controller with only one solar panel. Therefore, the wire with positive polarity and the wire with negative polarity that come from both systems should be connected to specified locations on the controller. At the final stage, the positive and the negative wires from controller (output) were connected to the battery. The second method (Fig. 3), is about the connection of smaller solar panels and the wind turbine to a controller. It is important to mention that the total area of small solar panels has an equivalent area to the single solar panel.

Fig. 2: Hybrid system – big solar panel with wind turbine.

Fig. 3: Hybrid system – small size solar panels with wind turbine.
In this method, all the small solar panels were divided into three groups of two solar panels and each two of them are connected in series. This means that the negative terminal of one solar panel should be connected to the positive terminal of the second one. Therefore, in series connections the ampere remains the same but the voltage is additive. In the next stage, the negative terminal and the positive terminal from each group will be connected to the controller, while the wind turbine connection to the controller remains the same as the previous connections. As mentioned in both cases, the wind turbine has the same dimension or structure but the dimension of solar panel is different in each method as shown in (Fig. 4).

Fig. 4: Hybrid system – small size solar panels at different locations with wind turbine.
(Fig. 5) shows the special designed hybrid controller. The controller was designed to tolerate a high voltage coming from both sources inputs while the attached components smoothed and reduced the voltage to 14 as a maximum output voltage.

Fig. 5: Hybrid controller.
The components of the hybrid controller consisted of bridge rectifier to ensure all the Voltage is 100% DC, capacitor to store the energy in a form of an electrostatic field, much like a small rechargeable battery, resistor that has an electrical resistance which is used in an electric circuit for protection, operation, or current control, diode to allow the electric current pass through one direction only, zener diode to Act as a voltage regulator which maintain a constant DC output voltage in despite of the variation in the input voltage, and Rechargeable battery which is a type of battery that is used for renewable energy storage. Using a rechargeable type instead of the regular one to allow the battery to be charged and discharged rapidly without being damaged.
As mentioned earlier three scenarios will be demonstrated and clarified in the following. Firstly, the wind turbine is set alone with its components and connections; this is the reference for the other two scenarios. To study the experimental results, the test took a duration of six days. The power output is measured by measuring the output voltage and current through a multimeter. In addition, the time that the system consumed in order to fully charge the battery was measured as well. Secondly, a solar panel is added to the system. In this case, the wind turbine and a solar panel have one output. Both wind turbine and solar panel are connected to an energy mixer which is the hybrid controller.
In this third and final scenario, small size solar panels are added to the wind turbine. However, the total area of the small solar panels is equivalent to the area of the one solar panel in the previous scenario (scenario 2). In this case, small solar panels were placed on the wind turbine to consume less area which is space efficient. Furthermore, it is also inspecting whether having one solar panel or multiple ones in different location is better for the system’s output. In this case, the connections of the panels should be considered as well. To maintain the voltage to be able to enter the circuit without any problem, the connection of the panels.
The power output from the big solar panel and the three blades horizontal axis wind turbine are 30W and 21.9 W, respectively. As mentioned previously, all components in both systems are being placed in one device which is the hybrid controller. For one run in the experimental work it took one day and the procedure is repeated four times to get a five sets of data where the average is calculated. This to make sure that the no big changes in the data as a results of changing in the weather conditions and in the systems their selves. The weather conditions are recorded for each run to make sure that a negligible effect of changing the surrounding conditions will not affect the power output in experimental measurements. Table 1 shows the readings of the weather at the time of testing.
| Date | Weather | Temperature | Average Wind Speed |
|
|---|---|---|---|---|
| Individual Systems Testing |
April 7, 2018 | Too sunny with passing clouds |
30°C | 2.53 m/s |
| April 8, 2018 | Sunny | 31°C | 3.359 m/s | |
| April 9, 2018 | Too sunny | 31°C | 3.00 m/s | |
| April 10, 2018 | Too sunny | 30°C | 6.55 m/s | |
| April 11, 2018 | Haze weather | 31°C | 6.73 reds | |
| April 12, 2018 | Haze weather | 35°C | 7.20 m/s | |
| Hybrid System Testing |
April 14, 2018 | Sunny and clear | 31°C | 4.89 m/s |
| April 16, 2018 | Sunny with scattered clouds Rained from time to time |
28°C | 8.07 m/s | |
| April 17, 2018 | Sunny and clear sky | 31°C | 4.08 m/s | |
| April I8, 2018 | Sunny | 32°C | 5.53 m/s |
Table 1: The weather conditions during the testing of the models.
Table 2 shows the data for each individual renewable energy system. The duration of the testing was 5 days (5 hours and a half per day). (Fig. 6) shows the power output measured. For each testing, an efficiency was calculated while a graph regarding the three individual systems of power is determined. Furthermore, the current and voltage are measured by using a multimeter which is connected in parallel to measure the voltage, while it is connected in series with the battery to measure the current.
| Time | large Solar panel | Small Solar panels | Wind Turbine | ||||||||||
|---|---|---|---|---|---|---|---|---|---|---|---|---|---|
| Voltage [V] |
Current [A] | Big Solar power [Watts] | Efficiency | Voltage [V] |
Current [A] | Small Solar Power [Watts] |
Efficiency | Wind Speed | Voltage [V] |
Current [A] | Wind Turbine Power [Watts] |
Efficiency | |
| 10:00 AM | 14.00 | 1.55 | 21.74 | 2.21 | 13.40 | 0.78 | 10.45 | 1.01 | 3.05 | 1.20 | 1.00 | 1.20 | 1.76 |
| 10:30 AM | 13.90 | 1.60 | 22.24 | 2.26 | 12.97 | 0.71 | 9.21 | 0.89 | 3.96 | 3.00 | 1.10 | 3.30 | 11.05 |
| 11:00 AM | 13.50 | 1.80 | 24.30 | 2.47 | 13.10 | 0.70 | 9.16 | 0.88 | 4.00 | 3.10 | 1.15 | 3.57 | 11.59 |
| 11:30 AM | 12.97 | 1.50 | 19.46 | 1.98 | 12.80 | 0.81 | 10.37 | 1.00 | 4.02 | 3.11 | 1.16 | 3.61 | 11.55 |
| 12:00 AM | 13.66 | 1.59 | 21.72 | 2.21 | 13.50 | 0.82 | 11.12 | 1.07 | 4.20 | 3.20 | 1.17 | 3.74 | 10.51 |
| 12:30 AM | 13.90 | 1.59 | 22.10 | 2.25 | 13.78 | 0.87 | 11.99 | 1.16 | 4.70 | 3.28 | 1.18 | 3.87 | 7.75 |
| 01:00 AM | 13.20 | 1.55 | 20.46 | 2.08 | 12.90 | 0.73 | 9.42 | 0.91 | 0.00 | 0.00 | 0.00 | 0.00 | 0.00 |
| 01:30 AM | 12.65 | 1.76 | 22.26 | 2.26 | 12.96 | 0.73 | 9.46 | 0.91 | 3.09 | 2.03 | 1.05 | 2.13 | 15.03 |
| 02:00 AM | 12.33 | 1.37 | 16.89 | 1.72 | 13.00 | 0.83 | 10.79 | 1.04 | 3.12 | 2.90 | 1.09 | 3.16 | 21.65 |
| 02:30 AM | 12.45 | 1.48 | 18.43 | 1.87 | 12.80 | 0.79 | 10.15 | 0.98 | 3.50 | 2.84 | 1.19 | 3.38 | 16.39 |
| 03:00 AM | 12.89 | 1.56 | 20.11 | 2.04 | 12.70 | 0.75 | 9.53 | 0.92 | 3.00 | 1.50 | 1.00 | 1.50 | 11.55 |
| 03:30 AM | 13.20 | 1.60 | 21.12 | 2.15 | 12.99 | 0.80 | 10.40 | 1.00 | 3.67 | 2.98 | 1.20 | 3.58 | 15.05 |
| 13.22 | 1.58 | 20.90 | 2.12 | 13.08 | 0.78 | 10.17 | 0.98 | 3.36 | 2.43 | 1.02 | 2.75 | 11.16 | |
Table 2: The power output and efficiency of the three renewable energy systems tested individually.

Fig. 6: Power output measured as function of time for the three individual renewable energy systems.
In the testing days in April, the weather was very sunny with passing clouds. The average temperature was 30°C, and the average wind speed was 2.53 m/s. As shown in Table 2 the maximum wind turbine’s power output was 3.9 W. Furthermore, there are times where the wind turbine has no power output due on the absence of wind (for example at 01 pm). However, the solar panels had a continuous output power the whole testing time in a day. The large solar panel’s minimum power resulted was 16.9 W and the maximum was 24.3 W. For the 6 small connected solar panels, the minimum power output was 9.1 W and the maximum was 11.99 W.
From the testing of individual systems, it can be seen that the wind turbine did not produce a continuous supply of energy on every testing day. The power output of the wind turbine is zero in the absence of wind. Moreover, the big solar panel resulted to have more power than the small solar panels. This is due to the type of connection of the small solar panels together, which affects the voltage and current produced from the solar panel(s).
After considering the individual systems as the base line. The hybrid system is tested. The first hybrid system was the wind turbine connected with one big solar panel. The second hybrid system is the wind turbine connected to six small size solar panels. Table 3 shows the results (power and efficiency) of testing the first system under the same weather conditions mentioned in Table 2. Table 4 shows the results (power and effieicncy) of the second hybrid system that consisted from the wind turbine and the six small size solar panels under the same weather conditions.
| Time | Wind Speed [m/s] | Voltage [V] | Current [A] | Hybrid Power (big Solar) [Watts] | Efficiency |
| 10:00 AM | 3.61 | 12.90 | 2.51 | 32.38 | 15.11 |
| 10:30 AM | 3.66 | 13.02 | 2.51 | 32.68 | 15.05 |
| 11:00 AM | 0.50 | 13.55 | 1.41 | 19.11 | 12.93 |
| 11:30 AM | 4.00 | 13.42 | 2.72 | 36.50 | 15.31 |
| 12:00 AM | 4.14 | 14.00 | 2.83 | 39.62 | 15.96 |
| 12:30 AM | 7.78 | 13.72 | 3.40 | 46.65 | 5.72 |
| 1:00 PM | 7.91 | 13.40 | 3.47 | 46.50 | 5.47 |
| 1:30 PM | 6.09 | 14.02 | 3.21 | 45.00 | 9.62 |
| 02:00 PM | 0.00 | 14.63 | 1.37 | 20.04 | 13.58 |
| 2:30 PM | 5.50 | 14.00 | 2.55 | 35.70 | 9.31 |
| 3:00 PM | 7.70 | 13.91 | 3.19 | 44.37 | 5.58 |
| 3:30 PM | 7.80 | 12.62 | 3.28 | 41.39 | 5.04 |
| Average | 4.89 | 13.60 | 2.70 | 36.66 | 10.72 |
| Time | Wind Speed [m/s] | Voltage [V] | Current [A] | Hybrid Power (big Solar) [Watts] | Efficiency |
| 10:00 AM | 3.61 | 12.90 | 2.51 | 32.38 | 75.53 |
| 10:30 AM | 3.66 | 13.02 | 2.51 | 32.68 | 75.24 |
| 11:00 AM | 0.50 | 13.55 | 1.41 | 19.11 | 64.63 |
| 11:30 AM | 4.00 | 13.42 | 2.72 | 36.50 | 76.56 |
| 12:00 AM | 4.14 | 14.00 | 2.83 | 39.62 | 79.79 |
| 12:30 AM | 7.78 | 13.72 | 3.40 | 46.65 | 28.60 |
| 1:00 PM | 7.91 | 13.40 | 3.47 | 46.50 | 27.36 |
| 1:30 PM | 6.09 | 14.02 | 3.21 | 45.00 | 48.08 |
| 02:00 PM | 0.00 | 14.63 | 1.37 | 20.04 | 67.89 |
Table 3: The power output and efficiency of hybrid renewable energy system results from connecting the wind turbine to one large solar panel.
| Time | Wind Speed [m/s] | Voltage [V] | Current [A] | Hybrid Power (Small Panels) [Watts] | Efficiency |
| 10:00 AM | 2.62 | 14.00 | 0.84 | 11.76 | 6.73 |
| 10:30 AM | 3.15 | 14.78 | 0.93 | 13.75 | 7.10 |
| 11:00 AM | 2.10 | 13.90 | 0.75 | 10.43 | 6.42 |
| 11:30 AM | 0.50 | 13.72 | 0.75 | 10.29 | 6.88 |
| 12:00 AM | 6.11 | 13.00 | 2.27 | 29.51 | 6.24 |
| 12:30 AM | 7.02 | 13.20 | 2.51 | 33.13 | 5.18 |
| 1:00 PM | 6.00 | 14.00 | 2.23 | 31.22 | 6.85 |
| 1:30 PM | 5.20 | 12.53 | 2.04 | 25.56 | 7.33 |
| 02:00 PM | 4.02 | 13.00 | 1.91 | 24.83 | 10.28 |
| 2:30 PM | 6.11 | 14.30 | 2.41 | 34.46 | 7.29 |
| 3:00 PM | 6.10 | 13.99 | 0.88 | 12.31 | 2.61 |
| 3:30 PM | 6.20 | 14.70 | 2.33 | 34.25 | 7.03 |
| Average | 4.59 | 13.76 | 1.65 | 22.62 | 6.66 |
| Time | Wind Speed [m/s] | Voltage [V] | Current [A] | Hybrid Power (Small Panels) [Watts] | Efficiency |
| 10:00 AM | 2.62 | 14.00 | 0.84 | 11.76 | 33.64 |
| 10:30 AM | 3.15 | 14.78 | 0.93 | 13.75 | 35.49 |
| 11:00 AM | 2.10 | 13.90 | 0.75 | 10.43 | 32.09 |
| 11:30 AM | 0.50 | 13.72 | 0.75 | 10.29 | 34.42 |
| 12:00 AM | 6.11 | 13.00 | 2.27 | 29.51 | 31.21 |
| 12:30 AM | 7.02 | 13.20 | 2.51 | 33.13 | 25.88 |
| 1:00 PM | 6.00 | 14.00 | 2.23 | 31.22 | 34.26 |
| 1:30 PM | 5.20 | 12.53 | 2.04 | 25.56 | 36.65 |
| 02:00 PM | 4.02 | 13.00 | 1.91 | 24.83 | 51.42 |
| 2:30 PM | 6.11 | 14.30 | 2.41 | 34.46 | 36.44 |
| 3:00 PM | 0.00 | 13.99 | 0.88 | 12.31 | 41.23 |
| 3:30 PM | 6.20 | 14.70 | 2.33 | 34.25 | 35.14 |
Table 4: The power output and efficiency of hybrid renewable energy system results from connecting the wind turbine to six small size solar panels.
The hybrid system is compared with the three individual systems. The results of comparison are shown in (Fig. 7).

Fig. 7: Power output measured with time for the three individual renewable energy systems compared with the two hybrid systems.
The aim in a renewable hybrid system is that the system will be able to give continuous supply of power in different weather conditions. Firstly, it the individual testing of energy systems; the big solar panel, the small solar panels and the wind turbine. The individual systems are tested in 6 days with a duration of five hours and a half from 10:00 AM until 3:30 PM. The readings are recorded each half hour.
After testing the systems individually, the systems have been tested again by combining the solar panel(s) to the wind turbine to create the hybrid system. Two types of hybrid systems are made, one is the wind turbine with the big solar panel (Hybrid System 1), and the other is the wind turbine with the 6 small solar panels connected together (Hybrid System 2). Moreover, the testing duration is the same as the testing duration of the individual systems which is from 10:00 AM until 3:30 PM (five and a half hours). This will show the comparison between having an individual system and a hybrid system.
The testing started with the big solar panel with the wind turbine. The weather was sunny and clear at 31°C with an average wind speed of 4.89 m/s. The power output of the hybrid system ranged from 19 W to 46 W, and the average is 39.11 W. The power output increased compared to the individual systems.
Overall, the power output comparison can be seen in graphs shown in (Fig. 7). The hybrid system is compared to the individual systems with the most similar weather conditions. It shows that the power output increased drastically when having a hybrid system. However, the big solar panel gives higher power output than the small solar panels. Moreover, the power output is continuous in the hybrid system unlike the individual system, where the power is zero for the wind turbine when there is no wind. In the hybrid system, when there is no wind the power decreases only. It does not reach zero like a single system due on having another source of input power.
Moreover, in the implementation phase the execution of the project have started with building the wind turbine. Then, the big and small solar panels connections. Afterwards, hybrid system is created thus, testing are made. The WBS of the implementation phase is shown in the Fig. 7 below:
Decision matrix is one of the most important management tools which is used to defend a decision based on the alternatives factors that can affect the decision such as cost, availability, quality, installation, durability and efficiency of the selected idea. This decision matrix shows that the comparison is between three listed solar panels that are consisting of Polycrystalline, Monocrystalline and Thin film.
The aim of this research was to experimentally investigate the performance of a hybrid system that utilized both solar and wind energy as renewable sources. The advantage of maximizing the power output and keep a continuous source of power supply were proved. The experimental study started by studying different scenarios in connecting the two sources together. In all the scenarios, the power output was measured by the output voltage and ammeter during six days. Before testing the hybrid system, individual investigation for big solar panel, small solar panels and the wind turbine were done. The results during the six days in different weather conditions showed that a continuous and significant amount of power is hardly achieved using wind turbine only. However, the comparison was between the big solar panel and the small ones. Where the small solar panels had an equivalent area to the large solar panel, results showed better performance of the big solar panel among the smaller size solar panels.
Finally, the data and results were recorded for hybrid system in two different cases, case one with its by using six solar panels and the other one is the big solar panel separately with the wind turbine. It showed that the power output increased with the both hybrid systems in general. However, the big solar panel gives higher power output than the small solar panels when connected to the wind turbine. In addition, the power output is continuous in the hybrid system in comparison with the wind turbine individually, and in hybrid system the power output was higher in comparison with the individual solar systems.
Copyright © 2026 Research and Reviews, All Rights Reserved