
ISSN (0970-2083)
ISSN (0970-2083)
1University BDT College of Engineering, Davangere, Karnataka, India
2Department of Environmental Science, Bio-Science Complex, Kuvempu University, Shankaraghatta 577 451, Karnataka, India
Visit for more related articles at Journal of Industrial Pollution Control
The physico-chemical profile of effluent from sugar mill was determined during 2003-04. The parameters measured are temperature (30°C) colour, turbidity (84.7 NTU) pH (8.1), electrical conductivity (5530μmhos/cm), BOD (6856 mg/L), COD (7432 mg/L), total dissolved solids (2516 mg/L), chloride (1894 mg/L) total alkalinity (254 mg/L), total hardness (342 mg/L), sulphate (540 mg/L), phosphate (224 mg/L), total acidity (45 mg/L), calcium (364 mg/L) and magnesium (151 mg/L). According to the permissible level suggested by Bureau of Indian Standards almost all the water quality parameters in the sugar effluents have been found to be very high and well above the permissible limits. It is concluded that the wastewater discharged from the sugar industry is highly polluted, as it exceeded the prescribed limits for irrigation and public use.
Water quality parameters, Sugar mill effluent, Irrigation
The developed countries have been used to exploit every bit of natural source to convert them into goods for their comforts to export them to needy developing countries. In doing this, the industrialized countries dump lot of materials in their environment which becomes polluted (Dalela 1985). The most often affected natural resource is our water resources, which is used to dispose our industrial and domestic wastes (Sharma, 1975). Effluents discharged from sugar mills contains a number of chemical pollutants, such a carbonate, bicarbonate, nitrite, phosphate, oil and grease in addition to total suspended solids volatile solids and score of other toxicants. These pollutants could bring about changes in temperature, humidity, oxygen supply, pesticide stress, etc., amounting to a partial or complete alteration in the physical, chemical and physiological spheres of the biota (Verma and Shukla, 1969). When the untreated effluents are discharged into the environment, they disrupt the ecosystem (Behera and Misra, 1985).
Sugar mill effluent samples were collected from the discharged stream of sugar mill situated in Bhadravathi town of Karnataka once in a month from December 2003 to May 2004. During sampling, the samples were collected in a 2 litre polythene carbuoys and mixed in equal proportions to get uniform homogeneous samples (Rainwater and Thatcher, 1960) Random selection procedure was adopted for the selection of both sampling unit and the sampling point in a given site (APHA, 1998). Tap water and 8M HNO3 were used to wash the polythene bottles of 100 mL capacity, which is used for the sample preservation followed by washing it with distilled water and finally with double distilled water (Jeffery, 1996). Then, the bottles were rinsed thrice with effluent samples and the effluent samples were stored in a refrigerator at 4°C, after adding the necessary preservatives (APHA, 1998). Preservatives are essential for retarding biological action, hydrolysis for chemical compounds and complexes and reduction of volatility of constituents. For measuring COD, H2SO4 was added to bring pH to 2 and then preserved. For phosphates, 20 mg mercuric chloride was added and refrigerated. During analysis, the mixed, homogeneous effluents after preservation, were taken out from the refrigerator. These samples were used for analysis of water quality parameters according to the standard methods reported in literature (Jeffery, 1996 and APHA, 1998). The other parameters such as temperature, pH and electrical conductivity were determined in the field itself (within 30 minutes). The other water quality parameters were determined within 82 hours, except BOD, which was determined only after 5 days of incubation at 20°C.
The values of range and average of various water quality parameters of wastewater generated from sugar industry collected from December 2003 to May 2004 have been summarized in Table 1 along with the permissible values prescribed by Bureau of Indian Standards (BIS, 1983) for drinking purpose, for industrial effluents discharged into inland surface water, on land for irrigation and into public sewers (BIS, 1983). The average temperature of sugar mill effluents is 30°C and the value of range is 25-35°C. The average value of temperature of the effluents sample is found to be ambient and almost equal to that of room temperature (30.5°C±2°C) observed on the day of sample collection. Hence, the sugar effluent is not thermally polluted. The value of pH fluctuated from 6.4 to 9.5 with an average of 8.1, which is not within the permissible level prescribed by BIS (5.5-9.0) for discharge of industrial effluents.

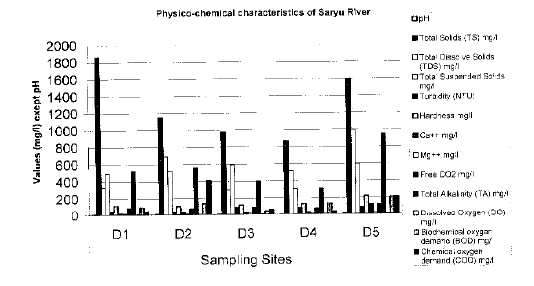
Table 1 Physico-chemical characteristics of Saryu River
Electrical conductivity is an excellent indicator of ionic forms of TDS, which is a measure of salinity that affects the taste of potable water (WHO, 1994). In the present investigation, the value of average and range of EC are 553 mmhos/cm and 492-680mmhos/cm respectively. EC value is found to be well below the tolerance limit of 3000 mmhos/cm suggested by BIS (1983). The values of average and range of total solids and total dissolved solids are 3070.1 mg/L and 1070-4610 mg/L and 2516 mg/L and 914-3698 mg/L respectively, which are also found to be very high. TS and TDS values are found to be well above the tolerance limit prescribed by BIS for the discharge of effluents and hence they are to be necessarily removed by primary and secondary effluent treatment methods before discharging the effluent in order to safeguard the environment.
Alkalinity causes corrosion and influences the chemical and biochemical reactions. The values of average and range of alkalinity of sugar mill effluents samples are 254 and 120-398 mg/L respectively. Hardness of water is due to the presence of dissolved chlorides, sulphates, carbonates and bicarbonates of calcium and magnesium ions. The average and range of total hardness are 342 mg/L and 270-465 mg/L respectively. Total hardness is below the tolerance limit prescribed by BIS (1983) (Table 1). Temporary hardness can be removed by boiling and permanent hardness could be removed with either ion-exchange method or reverse osmosis technique. Park and Park (1986), observed correlation between hardness of water and its role in heart disease, and Keller (1979) related hardness of water to both heart and kidney problems. According to Sawyer et al. (1994), the sugar effluents belongs to moderately hard water category and hence need treatment before discharge.
The values of average and range of sulphate and chloride ions (in mg/L) are 540 and 498-608.5 and 1894 and 1692-1907 respectively. The high content of these ions is responsible for high hardness and it increases the degree of eutrophication. Besides, the sugar effluent has more phosphate ions with an average of 224 mg/L (range 182-310 mg/L) than the allowed/permissible limit prescribed by BIS standards (5 ppm). Hence, the sugar industrial effluent is to be necessarily treated.
Biochemical oxygen demand (BOD) is a measure of biologically degradable organic matter. Chemical oxygen demand (COD) is a measure of chemically oxidisable organic matter. High load of organic compounds in the effluent may cause an increase in BOD and COD load and simultaneous depletion of DO concentration.
The observed values of BOD (average=6856 mg/L, range=5630-7015 mg/L) and COD (average=7432 mg/L, range=6763-8840 mg/L) are found to be very high and well above the limit prescribed by BIS, indicating a heavy load of organic compounds in the sugar effluents.
The average levels of calcium and magnesium ions varied 364 and 151 mg/L respectively. The range of calcium deviated form 281-476 mg/L, while magnesium content ranged from 99.8 to 272 mg/L. These cations exceeded the permissible limit as prescribed by BIS standards.
In sugar effluent the average value of oil and grease was 1.1 mg/L and the range of it was 0.9 to 1.25 mg/L. Similar observations reported by Ashok et al. (1988) and Baruah et al. (1993). The dissolved oxygen (DO) was ranged from 0 to 1.0 mg/L with an average of 0.5 mg/L (Table 1).
Copyright © 2026 Research and Reviews, All Rights Reserved