
ISSN (0970-2083)
ISSN (0970-2083)
Swapnila Roy*, Papita Das
Department of Chemical Engineering, Jadavpur University, Kolkata, India
Received date: 16 May, 2016; Accepted date: 12 June, 2016
Visit for more related articles at Journal of Industrial Pollution Control
Cellulose is the naturally occurring biomass material which has low density, thermal stability, bio compatibility. Sugarcane Bagasse (SCB) fibre waste is a renewable material which is effective raw material for production of the Cellulose. This present work is focused on comparative batch study on defluoridation by utilizing cellulose and activated carbon (AC) from SCB and to investigate the optimal process conditions using Cellulose and AC by Response Surface Methodology. Batch adsorption isotherm and reaction kinetics were also investigated applying two adsorbents in this present work. Both the adsorbents are well fitted to Langmuir model of isotherm rather than Freundlic model of isotherm, also well fitted to Pseudo second order reaction. In this study, it is demonstrated that regeneration percentage of activated carbon from SCB in 5 adsorption-desorption cycles are respectively 99.92%, 96.46%, 90.13%, 82.01%, and 72.53%. Hence, it can be used as effective adsorbent compared to cellulose for remarkable defluoridation efficiency from waste water
Fluoride adsorption; Sugarcane bagasse; Adsorption isotherm; Adsorption kinetics; Desirability function; Response surface methodology
Fluorine possess most electronegative and reactive properties in the periodic table, hence it cannot exist as an elemental form in nature. Fluoride is the smallest anion in the periodic table which has large tendency to act as a ligand, so it can be easily available in many organic compounds, plants, animals etc. Many of these compounds present in nature, where fluoride is sparingly soluble, so that fluoride can be accessible in dissociated(Kabay N, Arar O, Samatya S, Yüksel U, Yüksel. 2008) form in surface and ground water. In human physiological system, gastrointestinal tract is the pathway by which fluoride can be easily ingested to the human body. But the recent studies revealed that regular consumption of fluoridated water (Harrison PTC., 2005) above 1.5 mg/L can results in skeletal and dental fluorosis (Viswanathan G, Gopalakrishnan S, Siva Ilango S. 2010), also affect immunological system. Regular consumption of fluoride (Yadav AK, Kaushik CP, Haritash AK, Singh B, Raghuvanshi SP, Kansal A. 2007) occur from our daily foods, cosmetics, different types of exposure. Fluoride concentration in surface water and groundwater are dependent on general water quality parameters such as pH, acidity, hardness, total dissolved solids and other chemical parameters. In the world many fluoridated countries discharge waste water. According to WHO (WHO 2002) the tolerance limit of fluoride in surface water is 1.5 mg/L. There are many conventional methods (Antoniou G, Lyberatos G, Kanetaki EI, Kaiafa A, Voudouris K, Angelakis AN. 2014) such as precipitation, coagulation, reverse osmosis, electrochemical methods (Shen F, Chen X, Gao P, Chen G. 2003) etc. Among these different methods adsorption is the economically effective method for de-fluoridation. Adsorption is defined as the phenomenon where particular substance in solvent is deposited on the surface of solid adsorbent which has affinity towards that substance. In this case, the adsorbents are chemically synthesized product; activated carbon and cellulose from sugarcane bagasse. Many research studies revealed in earlier days that, RSM (Response Surface Methodology) was applied using Design Expert Software Version 7.6.1 (Stat Ease, USA). In this software 3D plots were not available. Usually, three level complete factorial designs (Box-Behnken model) was used to estimate the effects of major operating variables on fluoride adsorption and to find the combination of variables resulting in maximum de-fluoridation efficiency.
The objective of this present experimental investigation is to search out the optimum conditions (Banihabib ME, Valipour M, Behbahani SMR., 2012) for de-fluoridation by adsorption (Bhatnagar A, Kumar E, Sillanpää. 2011) in aqueous system utilizing modern statistical software. The application of statistical approach (Block P, Rajagopalan B. 2009) in adsorption process can result in improved product yields, also reduced variation in process parameters. In this study, the combined effects of adsorbent dose, reaction time, temperature on fluoride removal from aqueous medium by activated carbon and cellulose were investigated using CCD (Central Composite Design) in response surface methodology (RSM) (Moravejalahkami B, Mostafazadeh-Fard B, Heidarpour M, Abbasi F. 2009). The mechanism of adsorption by activated carbon and cellulose were thermodynamically studied by estimation of different factors such as Gibbs free energy, entropy, enthalpy. The novelty of the present investigation deals with comparative batch isotherm and kinetics study of de-fluoridation using two adsorbents from same source (Sugarcane Bagasse) and also optimized condition are determined using statistical software.
Adsorbent preparation
Preparation of cellulose from sugarcane bagasse
Firstly, 10.0 g of Bagasse pulp was dissolved in 100 mL distilled water for 24 h. Then the solution was filtered and 40 ml NaOH (0.25 M) was added to filtrate. Again, the suspension was filtered after keeping for 24 h. Then under reflux condition solution was boiled with a mixture of Nitric acid and Ethanol (20% v/v) for 3 hours. Next, suspension was again filtered and collected properly. Then filtrate was centrifuged (3000 rpm) for 30 min at room temperature until the pH of filtrate remain unchanged. Then it was filtered and the isolated cellulose was hydrolyzed in alkaline medium (50% NaOH) at 40°C for 1 h. Then newly obtained suspension was sonicated using ultrasonic processor for 15 min. After sonication, newly obtained solution indicates the presence of cellulose (Sun JX, Sun XF, Zhao H, Sun RC. 2004) which was dried at 105°C and then cooled and stored in air tight container for further experiment.
Preparation of activated carbon from sugarcane bagasse
The precursor used for preparation of AC in this case (Mohan D, Singh KP, Singh VK. 2008) is sugarcane bagasse. It was collected from local area. Firstly, it was purified by distilled water by washing and then dried at 378 K. Then it was grinded, then digested by dilute sulphuric acid, followed by carbonization in muffle furnace. The complete carbonization occurred at 723 K. Then it was cooled for 30 minutes and washed with distilled water to obtain neutral solution (pH 7). Finally it was prepared and then stored in an air-tight container.
Physicochemical analysis
The different physicochemical (Teixeiraa EM, Bondanciaa TJ, Teodoroa KBR, Corrêaa AC, Marconcinia JM, Mattosoa LHC. 2011) properties of the produced activated carbons were estimated using standard operating method. All the experiments were carried out thrice and results are shown in Table 1.
| Activated carbon prepared from Sugarcane Bagasse | Yield(%) | Bulk Density | Porosity | Moisturecontent | Ash content | pH |
| 78 | 0.78 | 0.73 | 5.4 | 13.5 | 7.01 |
Table 1: Physicochemical Analysis.
Yield of carbon
The prepared activated carbon was over heated (carbonization) at 723 K in muffle furnace and it was cooled. The initial and final weight of activated carbon were taken. From that data:
Determination of bulk density
Firstly, initial weight of dry empty centrifuge tube was taken (W1) and then the centrifuge tube was filled with the prepared activated carbon powder. Final weight (W2)was taken. The difference in the weight is indicated the weight of the activated carbon powder in tube. The bulk density was determined using the following equation:
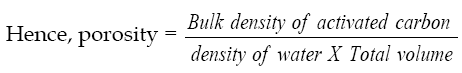
Porosity determination
The following formula is used to determine the porosity of activated carbon.
The pore volume of prepared activated carbon was obtained using the formula:
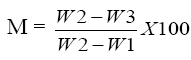
Determination of moisture content
The empty aluminium foil was dried at 105°C and then cooled. The initial weight (W1) was taken. Then the prepared known weight of activated carbon powder with foil were weighed (W2) and dried in an oven at 105°C. This weight was taken repeatedly at 30 minutes interval until the weight became constant. Then activated carbon with foil was cooled in a desiccator and reweighed (W3). The weight difference of the activated carbon is used to measure the moisture content (M) of the activated carbon from Sugarcane Bagasse.
Determination of ash content
The empty crucible was oven dried at 105°C and cooled, taken initial weight (W1). The known weight of prepared dried activated carbon powder was taken in the crucible and weighed (W2). After that it was kept in the muffle furnace at 800°C for 1 hour and then cooled.
Finally the crucible was reweighed (W3). The percentage ash content of activated carbon sample was achieved from the following equation:
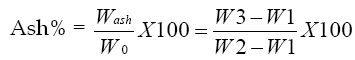
Where Wash= weight of ash (g)
Determination of pH
0.5 g activated carbon from SCB was dissolved in 10 ml distilled water. The mixture was heated and stirred for 15 minutes. Then it was filtered and pH was estimated using a digital pH meter.
Preparation of working fluoride solutions
Sodium fluoride (Merck, Germany) was used in this study. Stock fluoride ion solution (1000 mg L-1) was prepared by dissolving accurately weighed quantity in double-distilled water. Then 50 mg L-1 solution was prepared by diluting the stock solution and pH was adjusted by using 0.1 N NaOH or 0.1 N HCl.
Batch experiments
For batch experiments, 100 ml fluoride solutions of concentration 50 mgL-1 were taken in 250 mL PTFE conical flasks. The required amount of adsorbent (Cellulose and AC) were added to the solution. Then the flasks were agitated at 150 rpm in an incubator shaker at different temperatures. The effects of contact time (10-100 min), adsorbent dose (0.2 -1.5 g/100 ml) and temperature (303-333 K) were investigated during the batch studies. In this optimized experimental condition were determined.
Experimental setup
Experiments were conducted in temperature controlled incubator shaker (Innova 4430, New Brunswick Scientific, Canada). Temperature fluctuations in the shaker were negligible. After shaking for particular time intervals those samples were collected from the flasks for analysis of residual fluoride concentration in the solution. The dissolved (not adsorbed) fluoride in each conical flask was estimated by using ion-meter (Thermo Scientific Orion ion-meter, USA).
Batch studies
Adsorption isotherm
The isotherm models, Langmuir and Freundlic isotherms study were investigated by using cellulose and AC for defluoridation in water. The interaction between fluoride ions and adsorbents can be better explained by these isotherm models.
Langmuir isotherm
The linear form of Langmuir model is given by the following equation:
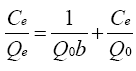 (1)
(1)
Where Ce is the residual fluoride concentration at equilibrium, Qe is the fluoride concentration adsorbed on the sorbent at equilibrium, Qo denotes maximum fluoride concentration and b is the Langmuir constant.
Freundlic isotherm
The Freundlich isotherm constants are estimated using the following equation:
 (2)
(2)
Where Qe is the amount of fluoride adsorbed at equilibrium, and KF and n are Freundlich Constants indicates adsorption capacity and adsorption intensity respectively
Adsorption kinetics
The adsorption process is carried out at various temperatures to determine the optimum temperature for maximum adsorption efficiency and for obtaining the reaction rate constant activation energy. 100 ml of fluoride solution of concentration 50 mg/L was taken in PTFE conical flask and 1 g adsorbent is added to it. Then this mixture was agitated at 150 rpm for 1 hour. From this experiment kinetic rate constant at different temperatures is estimated.
Pseudo first order kinetics
The rate constant is estimated using the following equation:
 (3)
(3)
Where, qe= fluoride adsorbed at equilibrium/unit weight of adsorbent (mg/g), qt is the amount of fluoride adsorbed at any instant (mg/g) and k1 is the rate constant (min-1).
Integrating at these conditions as t=0 and qt=0 to t=t and qt=qt', the final equation is written as given below:
 (4)
(4)
Pseudo second order kinetics
The model equation is described as follows:
 (5)
(5)
Where k2 denotes the pseudo-second-order rate constant of adsorption (g mg-1 min-1) and qe and qt are the amounts of fluoride adsorbed (mg/g) at equilibrium and at time respectively.
Activation Energy
From the obtained the rate constant, activation energy of the adsorption of fluoride is calculated using Arrhenius Eq (6).given as follows:
 (6)
(6)
Where Ea=activation energy (kJmol-1); R=gas constant (8.314 J mol-1 K-1); and A0=Arrhenius constant.
Adsorption thermodynamics
The adsorption thermodynamic parameters of fluoride are estimated using the following formulas:
 (7)
(7)
Where, Kc=coefficient of distribution for the adsorption; Ca= fluoride adsorbed per unit mass of the adsorbent (mg L-1); Ce=equilibrium concentration of adsorbate in aqueous phase (mg L-1).
 (8)
(8)
Where, G0 (kJ mol-1)=change of Gibb’s free energy; R=Universal gas constant; and T=absolute temperature (K); and
 (9)
(9)
Where ΔH0 (kJ mol-1)=change of enthalpy; ΔS0 (J mol-1 K-1)=change of entropy.
Statistical analysis
In order to maintain quality assurance, the precision, accuracy, repeatability and reproducibility of the obtained experimental data, all experiments were performed repeatedly. Data were analyzed and mean values and standard deviation (SD) obtained with Design Expert Version 9.1.6 (Stat Ease, USA).
Characterization of activated carbon from SCB XRD (X-ray Diffraction) analysis
X-ray diffraction analysis of the adsorbent was carried out using X-ray diffractometer equipment (Bruker, D8 Advance) with a Cu Ka radiation. The radiation filtered by a graphic mono chromatorat a setting of 40 kV and 130 mA. The XRD pattern of the as prepared activated carbon from sugarcane bagasse is depicted in Fig. 1(A).

Fig 1(A): XRD of activated carbon from sugarcane bagasse
SEM (Scanning Electron Micrograph)
The scanning electron microscope (SEM) image [JEOL-JSM-6360] of activated carbon from sugarcane bagasse at magnification 1500X and 500X were obtained are represented in Fig. 1(B) and 1(C) respectively.

Fig 1(B): SEM of activated carbon from sugarcane bagasse at 1500 X and 500X

Fig 1(C): SEM of activated carbon from sugarcane bagasse at 1500 X and 500X
Boehm titration
The surface acidity and basicity of the samples were estimated by the Boehm Titration method 0.2 g AC sample was added to 25 ml of 0.1 M NaHCO3 and similarly to 25 ml of 0.1 M Na2CO3. The mixtures were stirred for 24 hours and then it was filtered. After removal of carbon, the excess of base and acid was titrated with 0.1 M HCl solution and 0.1 M NaOH solution, respectively. Chemically number of acidic sites were estimated by chemical neutralization of carboxyl, phenolic and lactonic groups by NaOH; carboxyl and lactonic groups by Na2CO3; and carboxyl groups by NaHCO3. Similarly, the number of basic sites was estimated from the amount of consumed hydrochloric acid by AC (Table 2).
| Sample | Groups | Total acidity (meq g-1) | Total basicity (meq g-1) | ||
|---|---|---|---|---|---|
| Carboxylic (meq g-1) | Phenolic (meq g-1) | Lactonic (meq g-1) | |||
| AC from SCB | 0.21 | 0.29 | 0.29 | 0.89 | 1.01 |
Table 2: Acidic and basic surface characteristics of the activated carbons
Batch studies
Effect of contact time
In this experimental study, (Fig. 2) it is seen that activated carbon is much better adsorbent than cellulose for defluoridation in water. It is observed from the experimental study that on increasing the contact time at particular temperature, defluoridation efficiency increases in both cases. As the contact time increases, more is the number of fluoride ions attached on the adsorbent surface. The chemical explanation behind this phenomena is that accumulation of fluoride ions on adsorbent surface increases because of attraction force in between adsorbent surface and fluoride ion, as a consequence, de-fluoridation efficiency is increased. But after certain point (70 min), defluoridation efficiency decreases as shown in the curve. This was happened because at saturation point (70 min) maximum number of the fluoride ions attached on adsorbent surface. There is no significant increase after that point (70 min). So the optimized contact time is 70 min for further experimental studies. So the saturation point achieved at 70 min due to nonavailability of active site for fluoride adsorption.

Fig 2: Effect of contact time on removal of fluoride by AC and cellulose (experimental conditions:C0=50 mg L-1, agitation speed=150 rpm, T=333 K, adsorbent dose=1.0 g/100 ml)
Effect of adsorbent dose
In the above two cases it is observed (Fig. 3) that prepared activated carbon acted as a better adsorbent for defluoridation than cellulose. Within the experimental range of adsorbent dose in between 0.2 g-1.5 g/100 mL percent removal of fluoride gradually increases with increasing adsorbent dose, then decreases. The adsorbent dose in the range of 0.2-1.0 g/100 mL, de-fluoridation efficiency increases because of the number of ions increases on the adsorbent surface in both cases due to the attraction force of adsorbate ions with the adsorbent dose higher than 1.0 g/100 mL, shows decrease in removal on the adsorbent surface because surface of adsorbent reached the saturation point by fluoride ions, hence fluoride ions are further not adsorbed on adsorbent surface due to repulsive force.

Fig 3: Effect of adsorbent dose on removal of fluoride by AC and Cellulose (experimental conditions: C0=50 mg L-1, agitation speed=150 rpm, T=333 K, contact time: 70 min).
It can be explained that due to availability of active adsorption sites on the sorbent surface, the defluoridation efficiency increases. But after the equilibrium fluoride adsorption, decrease in defluroridation efficiency with increasing adsorbent dosage (above 1.0 g/100 mL).
Effect of temperature
It is investigated in the present experimental study (Fig. 4) that with increasing temperature, the percent removal of fluoride first increases from 300 K to 320 K. After 320 K, defluoridation efficiency decreases Following the adsorption process, increasing the number of adsorbate ions (fluoride) accumulate on adsorbent surface, the attractive force in between fluoride ions and adsorbent surface (cellulose and activated carbon) increases. But as temperature increases beyond 333 K, the repulsive force increases in between adsorbate and adsorbent surface and as a result, the defluoridation efficiency gradually increases with increasing temperature (up to 333 K), then decreases. From the experimental study it is proved that the prepared activated carbon is more efficient in removal of fluoride than cellulose extracted from SCB

Fig 4: Effect of temperature onremoval of fluoride by AC and cellulose (experimental conditions: C0=50 mg L-1, agitation speed=150 rpm, adsorbent dose=1.0 g/100 ml, contact time: 70 min)
Batch studies at optimized conditions:
Batch studies were investigated for de-fluoridation by using Cellulose and AC at the optimized conditions as given in Table 3. The optimized parameters for de-fluoridation is mentioned in that Table 3. These experimental results are observed according to the comparative batch studies of cellulose and activated carbon at different experimental conditions.
| Parameters | Cellulose | AC |
|---|---|---|
| Contacttime | 70 min | 70 min |
| Adsorbentdose | 1 g L-1 | 1 g L-1 |
| Temperature | 333 K | 333 K |
| Maximum Adsorptioncapacity | 34.17 mg.g-1 | 56.23 mg.g-1 |
| Equilibrium Isotherm Model | Langmuir | Langmuir |
| Kinetic Model | Pseudo Second Order | Pseudo Second Order |
Table 3: The optimized parameters for defluoridation using Cellulose and AC in Batch study.
Thermodynamic and kinetics study
Batch adsorption isotherm
The estimated adsorption equilibrium data for cellulose and activated carbon prepared from sugarcane bagasse was modeled applying Langmuir (Fig. 5) and Freundlich isotherms (Alagumuthu G, Veeraputhiran V, Venkataraman R, 2010) (Fig. 6) model. Using these two models the possible interaction between fluoride ions and prepared adsorbents are well understood. The isotherm parameters were shown in Table 4. From that Table 4, it is observed that value of R2 for cellulose and activated carbon are higher in case of Langmuir isotherm model rather than Freundlich model. The adsorption capacity of cellulose and activated carbon are 34.17 mg.g-1 and 56.23 mg.g-1 respectively. So it is indicated that Langmuir model is well fitted for two adsorbents than Freundlic model in present study of fluoride sorption. According to the Langmuir model, the monolayer fluoride adsorption took place in case of both adsorbents, depends on the surface homogeneity.

Fig 5: Langmuir Adsorption Isotherm plots of defluoridation onto AC and cellulose (experimental conditions: C0=50 mg L-1, agitation speed=150 rpm, T=333 K).

Fig 6: Freundlich adsorption Isotherm plots of defluoridation onto AC and cellulose (experimental conditions: C0=50 mg L-1, agitation speed=150 rpm, T=333 K).)
| Adsorbents | Langmuir | Freundlic | ||||
|---|---|---|---|---|---|---|
| Qe(mg g-1) | b(L mg-1) | R2 | KF(mg g-1) | n(L mg-1) | R2 | |
| Cellulose | 34.17 | 0.654 | 0.9919 | 76.54 | 3.23 | 0.9596 |
| Activated Carbon | 56.23 | 0.921 | 0.9974 | 89.23 | 6.79 | 0.9821 |
Table 4: Langmuir and Freundlich isotherm model constants and correlation coefficients for fluoride adsorption onto cellulose and activated carbon prepared from SCB at optimized conditions.
Batch Adsorption kinetics
The present adsorption kinetics studies (Asgari G, Roshani B, Ghanizadeh G, 2012) were investigated for the adsorbents cellulose and activated carbon for defluoridation. The parameters of kinetic studies are shown in Table 5. From this study, it is observed that pseudo second order kinetics study are well fitted than pseudo first order reaction. The correlation coefficient (R2) of pseudo-first order kinetics of cellulose and activated carbon are 0.9537 and 0.9827 respectively. Similarly, value of R2 of pseudo-second order kinetics are respectively 0.9871 and 0.999. From the pseudo second order kinetic reaction, it is indicated that adsorption capacity of both adsorbent are dependent on available binding site. The plot of log (qe-qt) vs. t (Fig. 7) and t/qt Vs t (Fig. 8) in pseudo first order and pseudo second order kinetic modeling are depicted. From the pseudo second order rate constant k2 at different temperatures, the activation energy Ea (Activated carbon) is estimated using the Arrhenius energy equation (Eq. 6). The slope calculated from Arrhenius equation is 48.29 kJ/ mol. The activation energy is greater than calculated value of Arrhenius energy. The comparative study of adsorption capacities, isotherm and kinetic models of various adsorbents which are already reported for fluoride removal with two adsorbents in the present work, represented in 5.7.
| Adsorbents | Pseudo first order kinetics | Pseudo second order kinetics | ||||
|---|---|---|---|---|---|---|
| k1(min) | qe(mg g-1) | R2 | k2(g mg-1) | qe(mg g-1) | R2 | |
| Cellulose | 0.0043 | 49.21 | 0.9537 | 0.0721 | 36.72 | 0.9871 |
| Activated Carbon | 0.00021 | 69.21 | 0.9827 | 0.0982 | 58.79 | 0.999 |
Table 5: Comparison of pseudo first order and pseudo second order rate constants for cellulose and activated carbon prepared from SCB at optimized conditions.

Fig 7: Pseudo first order kinetic model for adsorption of fluoride onto AC and cellulose (experimental conditions: C0=50 mg L-1, agitation speed=150 rpm, T=333 K)

Fig 8: Pseudo second order kinetic model for adsorption of fluoride onto AC and cellulose (experimental conditions: C0=50 mg L-1, agitation speed=150 rpm, T=333 K).
Estimation of thermodynamic parameters of activated carbon for defluoridation
From the experimental data following equation (7-9) it represents that the negative value of ΔG0 increases with increasing in the temperature (up to 333 K) which indicated that the adsorption is thermodynamically feasible in nature and the positive values of ΔH0 supports endothermic nature of the reaction due to consuming energy from the reaction system. The values of ΔH0 and, ΔS0 are estimated from the slopes and intercept of the plot lnKc vs. (1/T) (Fig. not given) and the values are listed in Table 6. It is observed that the negative value of ΔG0 at all temperatures represents that the defluoridation reaction is spontaneous in nature. In this case ΔG0 decreases up to 333 K (-9.13 kJ/mol to -14.13 kJ/mol) and after that at 343 K, it increases (-12.4 kJ/ mol) which implies that the adsorption reaction is feasible up to 333 K. As a result the randomness in between fluoride ion and activated carbon surface is increased. Due to endothermic reaction, it is expected that the uptake capacity of fluoride ions by activated carbon is increasing with temperature. After 333 K, the reverse reaction occurs. Mathematically entropy of the reaction is estimated from the experimentally obtained data that is positive (278.41 J mol-1 K-1). So it can be explained that as temperature is increased above 333 K, the desorption occur on the adsorbent surface which results the concentration of fluoride in solution in increased in small amount in solution
| SerialNo. | T, K | ΔG, kJ/mol | ΔH, kJ/mol | ΔS,J mol-1 K-1 |
|---|---|---|---|---|
| 1 | 318 | -9.13 | 68.13 | 278.41 |
| 2 | 328 | -11.41 | ||
| 3 | 328 | -13.52 | ||
| 4 | 333 | -14.13 | ||
| 5 | 343 | -12.4 |
Table 6: Thermodynamic parameters for the adsorption of fluoride onto activated carbon prepared from SCB.
Response surface methodology for optimisation of adsorption parameters
The determination of optimum conditions for fluoride adsorption by cellulose and activated carbon depends on the three process variables (Ergun E, Tor A, Cengeloglu Y, Kocak I, 2008) which are adsorbent dose, temperature and contact time of the solution. The experimental ranges along with the levels of variables are given in Table 7. The percent removal of fluoride is the response of the system. Statistically the prediction of the optimum condition is obtained following the quadratic equation model given below (Eq. 10).
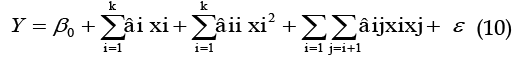 (10)
(10)| S.No | Variable | Unit | Notation | Range and levels(coded) | ||||
|---|---|---|---|---|---|---|---|---|
| –a | -1 | 0 | +1 | +a | ||||
| 1 | Adsorbent dose | g | A | 0.33 | 0.5 | 0.75 | 1.0 | 1.17 |
| 2 | Contact time | min | B | 16.36 | 30 | 50 | 70 | 83.6 |
| 3 | Temperature | K | C | 299.4 | 308 | 320.5 | 333 | 341.5 |
Table 7: Experimental range and levels of independent variables.
Y = ßHere, Y=response (i.e. dependent variable), ß0=constant coefficient, ßi=ßii=ßij=coefficients of linear, quadratic and interaction effect, xi and xj= factors (independent variables) and e=error
Percentage of fluoride removal efficiency is calculated with a standard RSM design (CCD) (Jain M, Garg VK, Kadrivelu K, 2011) and 20 experiments are performed for both adsorbents. The percent removal (%) of fluoride is determined by using the following equation (11):
 (11)
(11)Where Ci is the initial fluoride concentration (mg L-1) and C0 is the final fluoride concentration in solution (mg L-1).
Design Expert Version 9.1.6 (Stat Ease, USA) is applied for graphical analysis of the experimentally obtained data. The optimum values of the independent variables are obtained by solving the regression equation and by analyzing the response surface 3D plots (Amini M, Younesi H, Bahramifar N, Lorestani AAZ, Ghorbani F, Daneshi A, Sharifzadeh M. 2008). The coefficient of correlation and the quadratic model equation is used to predict the interaction effect of different factors within the specified range, which can be described mathematically.
Estimation of response surface for maximum fluoride removal
From CCD analysis for both adsorbents it is observed that the maximum fluoride removal is obtained in case of activated carbon 92.31% and in case of cellulose 67.35% at 70 min contact time, at 333 K and 1 g/L of adsorbent dosage.
In this present study, response surface quadratic model (Garg UK, Kaur MP, Sud D, Garg VK. 2009) represented that the interaction effects of adsorbent dose, contact time and temperature. The interaction among the different independent variables and their corresponding effect on the response surface plots are represented (Figs.9-12).

Fig 9A: AC. The graph showing predicted removal % Vs actual removal% of fluoride by adsorption

Fig 9B: Cellulose. The graph showing predicted removal % Vs actual removal% of fluoride by adsorption

Fig 10A: AC. Response surface plots showing interaction effect of contact time and temperature

Fig 10B: Cellulose. Response surface plots showing interaction effect of contact time and temperature

Fig 11A: AC. Response surface plots showing interaction effect of adsorbent dose and temperature

Fig 11B: Cellulose. Response surface plots showing interaction effect of adsorbent dose and temperature

Fig 12A: AC. Response surface plots showing interaction effect of adsorbent dose and contact time

Fig 12B: Cellulose. Response surface plots showing interaction effect of adsorbent dose and contact time.
The response variable which is expressed as a function of independent variables defined in multiple regression model, developed by the software is expressed in the form of different numerical factors in equation (12,13)given below:
Removal (%) by activated carbon
R1 =+90.55+0.81*A+0.34*B+0.44*C+0.34*AB+0.45*A C+0.053*BC+0.077*A2-0.20*B2 (12)
Removal (%) by cellulose
R1=+47.22+3.09*A+1.19*B+3.21*C+0.86*AB-1.28*AC +1.39*BC+4.22*A2+2.05*B2+5.74* C2 (13)
The goodness of fit model is verified by the correlation coefficient between the experimental and model predicted values of the response variable (Figs. 9A and 9B) A high R2 value (Activated carbon: 0.9871, Cellulose: 0.9772) indicates high correlation between the values of the predicted variable by experimental and model. Therefore, practical the applicability of the quadratic model is used to predict the defluoridation efficiency in solution within the limits of the experimental factors.
Interaction effect
Effect of variation in contact time and temperature
The effect of different temperature and contact time are required to remediate fluoride in solution using activated carbon and cellulose. It is illustrated in the both response surface plot as shown in Figs. 10A and 10B. It is evident that both the independent process variables are very effective on the percentage fluoride adsorption process. From these response surface plots, a maximal removal efficiency of 92.31% and 67.35% for activated carbon and cellulose respectively are achieved at 333 K and 1.0 g of adsorbent dose while the other variable is set at the middle value. As the temperature increased from 300-333 K, the fluoride uptake capacity increased at particular adsorbent dose which indicated that at higher temperature with higher contact time, the percentage of bound fluoride ions adsorbed increases (due to higher attraction force between fluoride ions and adsorbent surface), as a result of which percentage efficiency of removal of fluoride ions increased.
Effect of variation in adsorbent dose and temperature
The combined effect of adsorbent dose and temperature for adsorption on fluoride removal is depicted in the both response surface plots of Fig. 11A and 11B. It is observed that percentage of fluoride removal increased in increasing the temperature from 300 K to 333 K and also increases in the range of adsorbent dose from 0.33-1.0 g. This suggests that higher values of fluoride removal may be obtained by increase in temperature and also with increase in adsorbent dose. As adsorbent dose increased, the percentage removal of fluoride increased which supported the attractive forces between fluoride ion and adsorbent at low pH. As adsorbent dose of the solution increased, electrostatic force of attraction between the fluoride ions and adsorbent surface also increases. From this response surface plot, a maximal removal efficiency of 92.31% and 67.35% for activated carbon and cellulose respectively, are achieved at an 1.0 g adsorbent dose, at 333 K and 70 min of contact time.
Effect of variation in adsorbent dose and contact time
The both response surface plots of Fig. 12A and 12B demonstrated the interaction effects of two independent variables (contact time and adsorbent dose). It is experimentally proved that within the experimental range of dosage of adsorbent (0.33-1.0 g) and contact time (20 min- 80 min), the optimum point is determined as (1.0 g, 70 min). In that condition the de-fluoridation efficiency is the highest due to attractive forces between fluoride ions and adsorbent surface is maximum. After that point the adsorbent surface is saturated by fluoride ions. Consequently, repulsive forces between fluoride ions and adsorbent increases, so de-fluoridation efficiency is decreased gradually. According to the depicted plots, defluoridation efficiency is increased with increase in dosage of adsorbent and contact time. The previous sentence is followed by maximum removal efficiency of 92.31% and 67.35% for activated carbon and cellulose respectively, which is achieved at 70 min contact time and adsorbent dose of 1.0 g.
Confirmational study
The statistically derived data are supported by numerical modeling, which are verified by confirmatory experiments as suggested by the model (adsorbent dose 1.0 g; temperature 333 K; contact time 70 minutes). These are found to be optimum condition for maximum percent de-fluoridation. In that condition the maximum de-fluoridation efficiency of activated carbon is achieved as experimentally 92.31% and theoretically 92.37%. The difference between the removal efficiency in the two conditions being 0.06%. Similarly, in case of cellulose, the difference between de-fluoridation efficiency is 0.08%. These are very low values as well as negligible. Here error data obtained after repeating the experiment.
Probable mechanism of fluoride adsorption
The interface between adsorbate (ions dissolved in fluid) and adsorbent (solid) is generated by adsorption (Salifu A, Petrusevski B, Ghebremichael K, Modestus L, Buamah R, Aubry C, Amy GL. 2013) which depends on diffusion of ions on solid surface. Chemically, adsorbate and adsorbent are bonded by weak intermolecular forces. There are many practical application of adsorption study such as adsorption capacity, particle size, percent of regeneration of adsorption, cost effectiveness etc. Defluoridation efficiency also depends on several process parameters such as initial fluoride concentration, pH, temperature, contact time and adsorbent dose. In this study the external mass transfer may happen, which can be described in this way that transportation of adsorbate (fluoride) ions to the external surface of adsorbent from the solution crossing the boundary layer surrounded the adsorbent particle.
Desorption study
The desorption study of adsorbent in water treatment process is very significant. As the activated carbon prepared from SCB show higher defluoridation efficiency (56.23 mg g-1) compared to cellulose extracted from SCB, so its desorption study was estimated by adsorption–desorption cycles. In the present adsorption- desorption study, it was performed with 100 ml of 50 mg.Lg-1 of synthetic fluoride solution at the starting of each cycle. The study was conducted with 1% sodium hydroxideas desorbing agent. The adsorption capacities of each cycle were 99.92%, 96.46%, 90.13%, 82.01%, and 72.53%. These experimental results (Fig. 13) showed that activated carbon prepared from SCB can be reused for defluoridation in water.

Fig 13: Regeneration of activated carbon.
The present experimental study was carried out with the target of studying fluoride adsorption process onto cellulose and activated carbon prepared from sugarcane bagasse and to find out the effect of various process parameters on fluoride removal using batch isotherm, kinetics study and response surface methodology. The adsorption studies were carried out as a function of temperature, contact time, adsorbent dose. The de-fluoridation efficiency was majorly affected by reaction temperature, contact time, adsorbent dose. The level of the three variables such as temperature 333 K, contact time 70 min, adsorbent dose 1.0 g were found to be optimum for maximum de-fluoridation for both adsorbents. The corresponding percentage of defluoridation in optimum conditions was found to be 92.31% and 67.35% in case of activated carbon and cellulose respectively. Both the adsorbents are well fitted to the Langmuir isotherm model and follow pseudo second order kinetic model. As sugarcane bagasse is easily available, so the chemical synthesis of activated carbon is not so difficult process, so it can be used as an effective adsorbent for removal of fluoride ion from solution. Comparative adsorption study of different adsorbents along with activated carbon and cellulose extracted from sugarcane bagasse are represented with adsorption capacity, isotherm model (Table 8). From that study it is experimentally proved that activated carbon is the better adsorbent for de-fluoridation rather than cellulose or other adsorbents.
| Sorbent | Maximumadsorbent capacity | Isotherm | Kinetic model | Reference |
|---|---|---|---|---|
| Magnetic chitosan particle | 22.49 mg·g-1 | Two-sites Langmuir isotherm | Pseudo-second-order | W. Ma, F.Q. Ya, M. Han, R. Wang(2007) |
| Multifunctional chitosan beads | 1800 mg·kg-1 | Langmuir, Freundlich | Pseudo-second-order | N.Viswanathan, C.S. Sundaram, S. Meenakshi (2009) |
| Glutaraldehyde Crosslinked Calcium Alginate | 73.5 mg·g-1 | Langmuir | Pseudo-second-order | Y. Vijaya, S.R. Popuri, A.S. Reddy, A.Krishnaiah(2011) |
| Chitosan Coated Silica | 44.4 mg·g-1 | Langmuir, Freundlich | Pseudo-second-order | Y. Vijaya, A. Krishnaiah (2009) |
| La(III) incorporated carboxylated chitosan beads | 4711 mg·kg-1 | Freundlich | Pseudo-second-order | N.Viswanathan,S.Meenakshi(2008) |
| Magnesia/chitosan composite | 4440 mg·kg-1 | Freundlich | Pseudo-second-order | C.S.Sundaram,N.Viswanathan, S.Meenakshi(2009) |
| Nano-hydroxyapatite/chitin composite | 2840 mg·kg-1 | Freundlich | Pseudo-second-order | C.S.Sundaram,N.Viswanathan, S.Meenakshi(2009) |
| Hydrotalcite/chitosan composite | 1255 mg·kg-1 | Langmuir | Pseudo-second-order | N.Viswanathan,S.Meenakshi(2010) |
| Chitosan supported zirconium(IV) tungstophosphate composite | 2025–2142 mg·kg-1 | Freundlich | Pseudo-second-order | N.Viswanathan, S.Meenakshi(2010) |
| Aluminum impregnated chitosan | 1.73 mg·g-1 | Freundlich | Pseudo-first-order | S.K. Swain, R.K. Dey,M. Islam, R.K. Patel, U. Jha, T. Patnaik, C. Airoldi(2009) |
| Chitosan based mesoporous Ti–Al binary metal oxide | 2.22 mg·g-1 | Langmuir | Pseudo-second-order | D. Thakre, S. Jagtap, N. Sakhare, N. Labhsetwar, S. Meshram,S. Rayalu(2010) |
| Zirconium(IV)-impregnated collagen fiber | 2.18 mmol·g-1 | Langmuir | Pseudo-first-order | X.P. Liao, B. Shi(2005) |
| Alumina/chitosan composite | 3809 mg·kg-1 | Freundlich | Pseudo-second-order | N.Viswanathan,S.Meenaksi (2010) |
| Chitosan based mesoporous alumina | 8.264 mg·g-1 | Langmuir | Pseudo-second-order | S.Jagtap, M.K.N.Yenkie,N.Labhsetwar,S.Rayalu(2011) |
| Activated Carbon(Sugarcane Bagasse) | 56.23 mg g-1 | Langmuir | Pseudo-second-order | Present Study |
| Cellulose(Sugarcane Bagasse) | 34.17 mg g-1 | Langmuir | Pseudo-second-order | Present Study |
Table 8: Comparative study of adsorption capacity, isotherm and kinetic modeling of various adsorbents with the Cellulose and AC synthesized in this study.
This study was supported by Department of Chemical Engineering, Jadavpur University, India and West Bengal Pollution Control Board, India. Authors are thankful for their support and service.
Copyright © 2025 Research and Reviews, All Rights Reserved