
ISSN (0970-2083)
ISSN (0970-2083)
Supriya Biswas# and Pratibha S. Kurup*
Shankrachrya Groups of Institutions, Junwani Bhilai, India
*Chhatrapati Shivaji Institute of Technology, Balod Road, Durg C.G, India
Received date: 23 February 2012 Accepted date: 15 April 2012
Visit for more related articles at Journal of Industrial Pollution Control
Micro emulsions and surfactants are of great use because they are clear, stable, isotropic liquid mixtures of oil, water and surfactant, frequently in combination with a co surfactant. There sensitivity gives great results. It is a thermodynamically stable dispersion of two immiscible fluids; the system is stabilized by added surfactant. In this paper an effort has been done in the field water analysis with the help of anionic surfactant. With the help of sensitivity of anionic surfactant the physicochemical and metal analysis of bore well water samples from different parts of Maharashtra were carried out. The values of the physicochemical properties vary significantly except for the temperature, colour, chloride which are closely related. These metal values are within the acceptable values in the World Health Organization Guidelines value for Drinking Water Quality.
Essential and Desirable parameter of water, Metal concentration, Microemulsions, Surfactants,.
Water is the most essential basic necessity of life. However, pure water needed for human consumption does not always occur in nature, due to the presence of dissolved or suspended impurities in most natural water bodies (Goldface, 1999). Also the availability of good quality water is an indispensable feature for preventing diseases and improving quality of life (Oluduro and Aderiye, 2007). Bore Well water is the main source of water for domestic use, it contains metal along with other properties. Metals for example, are introduced into aquatic system through several ways which include, weathering of rocks and leaching of soils, dissolution ofaerosol particles from the atmosphere and from several human activities, including mining, processing and the use of metal based materials (Ipinmoroti and Oshodi, 1993; Adeyeye, 1994; Asaolu et al., 1997). Metals after entering the water many be taken up by fauna and flora and eventually, accumulated in marine organisms that are consumed by human being (Asaolu et al., 1997) interactions (Deuzane, 1979; Dee, 1989). On several occasions, the well water is pumped into houses or fetched manually. Generally, the water samples are used for washing, cooking and even for drinking. The challenge is as clear and compelling as pristine water.
cascading down a mountain stream: We must find new and equitable ways of saving, using and recycling the water that we have (Atalay et al., 2008). The determination of the metal content of the samples is of great importance, because, despite the fact that trace elements are essential to man, at elevated levels, essential and non-essential elements can cause morphological abnormalities: reduce growth, increase mortality and mutagenic effects (Nkono and Asubiojo, 1998; Asaolu, 2002; Adeyeye, 2000). The physicochemical and metal analysis of bore well water samples from different parts of Maharashtra were carried out using anionic surfactant. Comparing the results of the physicochemical and mineral analysis of these well water samples with potable water standards provided by World Health Organization will therefore enable us to know the portability of the well water samples in Maharashtra.
Why surfactant
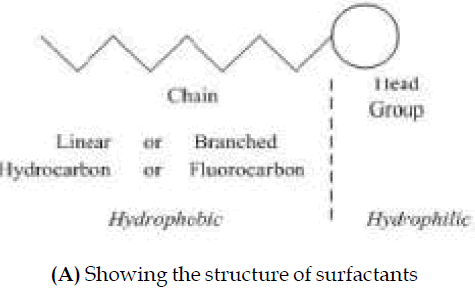
Surfactants are substances which alter the surface properties of liquids, even when present in small quantities. Composed of two fractions, a lyophilic group and a lyophobic group, surfactants migrate to the surface, resulting in the lyophilic portion lying within the solution and the lyophobic group orienting itself away from the solution. This orientation of the surfactant reduces the free energy of the surface, thus decreasing surface tension and increasing surface viscosity. The selection of surfactant is very important to ensure the efficiency of complexometric process. The chemical classification of surfactant is based on the nature of the hydrophilic head with the subgroup based on the nature of hydrophobic tail. Basically the surfactant can be classified into four groups they are Anionic, cationic, nonionic and Amphoteric. The present analysis is done by using the anionic surfactant because it is cheap, easily available.
(B) Showing the micelle formation of surfactant
Experimental method
A) Essential parameters
Tests were done and results were analyzed on the base of the Indian Standard: Drinking water – Specification IS: 10500: 1991. Water quality characteristic of aquatic environment arise from a multitude of physical, chemical and biological interactions (Deuzane, 1979; Dee, 1989). The standard categories various characteristics as essential or desirable. The Standard also mentions the desirable limit, permissible limit in the absence of alternate source and indicates their background. Short description of meaning and significance for the health and environmental the measured parameters:
Odour
Odour is recognized as a quality factor affecting acceptability of drinking water and food prepared from it, tainting of fish and other aquatic organisms and aesthetics of recreational waters. Most organic and some inorganic chemicals contribute taste or odour. These chemicals may originate from municipal and industrial waste discharges, natural sources, such as decomposition of vegetable matter or from associated microbial activity.
Turbidity
The Turbidity in water is the reduction of transparency due to the presence of particulate matter such as clay or silt, finely divided organic matter, plankton or other microscopic organisms. These cause light to be scattered and absorbed rather than transmitted in straight lines through the sample. The colloidal material exerts turbidity provides adsorption sites for chemicals that may be harmful or cause undesirable tastes and odors. Disinfection of turbid water is difficult because of the adsorptive characteristics of some colloids and because the solids may partly shield organisms from disinfectant. In natural water bodies, turbidity may impart a brown or other colour to water and may interfere with light penetration and photosynthetic reaction in streams and lakes.
pH value
pH value is the logarithm of reciprocal of hydrogen ion activity in moles per liter. In water solution, variations in pH value from 7 are mainly due to Hydrolysis of salts of strong bases and weak acids or vice versa. Dissolved gases such as carbon di oxide, hydrogen sulphide and ammonia also affect the pH of water. The overall pH range of natural water is generally between 6 and8. Industrial wastes may be strongly acidic or basic and their effect on pH value of receiving water depends on the buffering capacity of water. pH lower than 4 will produce sour taste and higher value above 8.5 bitter taste. Higher value of pH has the scale formation in water heating apparatus and reduces the germicidal potential of chlorine. pH below 6.5 starts corrosion in pipes, thereby releasing toxic metals such as Zn, Pb, Cd, Cu etc.
Total Hardness
Hardness of water is caused by the presence of multivalent metallic cations and is largely due to calcium, Ca++, and magnesium, Mg++ ions. Hardness is reported in terms of CaCO3. Hardness is the measure of capacity of water to react with soap, hard water requiring considerably more soap to produce a Lather. It is not caused by single substance but by a variety of dissolved Polyvalent metallic ions, predominantly calcium and magnesium cations. The low and high value of Hardness has advantages and disadvantages. Absolutely soft water is tasteless. On the other hand, hardness upto 600 mg/L can be relished if got acclimatized to. Moderately hard water is preferred to soft water for irrigation purposes. Absolutely soft water is corrosive and dissolves the metals. More cases of cardiovascular diseases are reported in soft water areas. Hard water is useful to growth of children due to presence of calcium.
Iron
Anaerobic ground waters may contain iron II at concentrations up to several Milligrams per liter without discoloration or turbidity in the water when directly pumped from a well. Taste is not usually noticeable at iron concentrations below 0.3 mg/L, although turbidity and colour may develop in piped systems at levels above 0.05 to 0.1 mg/L. Iron is an essential element in human nutrition. Estimates of the minimum daily requirement for iron depend on age, physiological status, sex and iron bio-availability and range from about 10 to 50 mg/day. Although iron has got little concern as a health hazard but is still considered as a nuisance in excessive quantities. Long time consumption of drinking water with a high concentration of iron can lead to liver diseases (hemosiderosis). Iron also promotes the growth of ironbacteria. This gives a rusty appearance to the waters. Colonies of these bacteria may also form a slime which causes problems in water closets, pipes, pumps and distribution system. High concentration of iron in water is not suitable for processing of food, beverages, ice, dyeing, bleaching and many other items. Water with high concentration of the iron when used in preparation of tea and coffee, interacts with tanning giving a black inky appearance with a metallic taste. Coffee may even become unpalatable at concentration of iron more than 1 mg/L.
Colour
Colour in water may be due to the inorganic ions, such as iron and manganese, humus and peat materials, plankton, weeds and industrial wastes. The term colour is used to mean the true colour of water from which turbidity has been removed. The term apparent colour includes not only the colour due to substances in solution but also that due to suspended matter. Apparent colour is determined on the original sample without filtration or centrifugation.
Total Dissolved Solids
Total dissolved solids is the term applied to the residue remaining in a weighed dish after the sample has been passed through a standard fiber glass filter and dried to constant mass at 103 – 105oC or 179 – 181 oC. Many dissolved substances are undesirable in water. Dissolved minerals, gases and organic constituents may produce aesthetically displeasing colour, taste and odor. Some dissolved organic chemicals may deplete the dissolved oxygen in the receiving waters and some may be inert to biological oxidation, yet others have been identified as carcinogens. Water with higher solids content often has a laxative and sometimes the reverse effect upon people whose bodies are not adjusted to them. High concentration of dissolved solids about 3000 mg/L mayalso produces distress in livestock.
B) Desirable parameters
Calcium
Calcium is a major constituent of various types of rock. It is one of the most common constituents present in natural waters ranging from zero to several Hundred milligrams per liter depending on the source and treatment of the water. Calcium is a cause for hardness in water and incrustation in boilers.
Desirable limit- Calcium is usually one of the most important contributors to hardness. Human body requires approximately 0.7 to 2.0 grams of calcium per day as a food element, excessive amounts can lead to the formation of kidney or gallbladder stones.
Magnesium
Magnesium is a common constituent in natural water. Magnesium salts are Important contributors to the hardness to the hardness of water which break down when heated, forming scale in boilers. The magnesium concentration may vary from zero to several hundred milligrams. Chemical softening, reverse osmosis, electro dialysis, or ion exchange reduces the magnesium and associated hardness to acceptable levels.
Desirable limit - Standard for Drinking Water (BIS 105000) Desirable Limit: 30 mg/L Permissible limit in the absence of an alternative source:100 mg/L.
Manganese
The intake of manganese can be high as 20 mg/day without apparent ill effects. It should be noted that manganese may be objectionable to consumers if it is deposited in water mains and causes water discoloration. Although concentrations below 0.1 mg/ L are usually acceptable to consumers, this may vary with local circumstances.
Copper
Copper is found mainly as a sulphide, oxide, or carbonate in the minerals. Copper enters the water system through mineral dissolution, industrial effluents, because of its use as algaecide and insecticide and through corrosion of copper alloy water distribution pipes. It may occur in simple ionic form or in one of many complexes with groups, such as cyanides, chlorides, ammonia or organic ligands. The tests for copper is essential because of dissolved copper salts even in low concentrations are poisonous to some biota.
Desirable limit for copper in potable water is 0.05 mg/L maximum which can be relaxed in the absence of better alternate source to 1.5 mg/L
Zinc
Zinc is one of the important trace elements that play a vital role in the physiological and metabolic process of many organisms. Nevertheless, higher concentrations of zinc can be toxic to the organism (Rajkovic et al., 2008). It plays an important role in protein synthesis and is a metal which shows fairly low concentration in surface water due to its restricted mobility from the place of rock weathering or from the natural sources (Rajappa et al., 2010). Zinc is an essential and beneficial element in body growth. Concentrations Above 5 mg/L may cause a bitter astringement taste and opalescence in alkaline water. Zinc most commonly enters the domestic supply from deterioration of galvanized iron and dezincification of brass. Zinc in water may also come from individual water pollution.
Desirable limit :The detection levels for other zinc salts were somewhat higher. Water containing zinc at concentrations in the range 3–5 mg/L also tends to appear opalescent and develops a greasy film when boiled (Adeyeye, 1994)). In natural surface waters, the concentration of zinc is usually below 10 ¼g/L and in groundwaters, 10–40 ¼g/L (Adefemi, et al. 2007). In tapwater, the zinc concentration can be much higher as a result of the leaching of zinc from piping and fittings.
Alkalinity
Alkalinity of water is its quantitative capacity to react with a strong acid to a designated pH. Highly alkaline waters are usually unpalatable. Excess alkalinity in water is harmful for irrigation which leads to soil damage and reduce crop yields. Alkalinity is significant in many uses and treatments of natural and wastewaters. Alkalinity measurements are used in the interpretation and control of water treatment processes.
Conductivity
Specific conductance yields a measure of water’s capacity to convey an electric Current. This property related to the total concentration of the ionized substances in water and the temperature at which the measurement is made. The nature of the various dissolved substances, their actual and relative Concentrations, and the ionic strength of the water sample vitally affect the Specific conductance. Essential characteristics we analyzed in the water from Maharashtra area are:
1. Colour
2. Odour
3. Turbidity
4. pH value
5. Total hardness
Desirable characteristics we analyzed in the water from Maharashtra area are:
1. Total dissolved solids
2. Calcium
3. Copper
4. Magnesium
5. Iron
7. Alkalinity
Parameters we analyzed which are not in standard:
1. Conductivity
Sampling
Samples of water were collected from Bore wells located in five different districts in Maharashtra. Namely; Akola-Balapur, Ahmadnagar Shirdi, Buldana-Shegaon, Ahmadnagar - Shani Shingnapur, Jalna-Chikhili. Clean plastic containers were used for the collection of the water samples and labeled appropriately.
Analysis of Essestial Parameters
Temperature (°C), pH and Electrical Conductivity (EC) in ¼scm-1 were determined almost immediately after collection of the water samples, using a Mercury Thermometer, pH meter and a Conductivity meter. The total dissolved solid or residue was calculated from the relationship: TDS= 0.01 EC The colour of the water was measured by the use of a visual comparator matching the colour of the sample with standard (APHA, 1989; Ademoroti, 1996). Odour and taste were determined using the sense organs for taste and smell. The Total Hardness (mg/L CaCO3) was determined using EDTA Titremetric method and other parameters were determined according to Ademoroti, 1996 and Andrew et al. 1995.
Metal analysis
Complexometric titration i.e. EDTA method was used for the determination of metals such including Calcium, Magnesium, Nickel, and Copper. Analytical method was used for the determination of iron.
Aliquot prepration
Two sets of sample were prepared, one for standard reading (without surfactant) and with Surfactant. For standard reading sample was only diluted with distill water.10 mL of water sample was taken and diluted with 50 mL of distilled water and 1mL of surfactant (0.05N) was added and the titration was performed
Statistical analysis
The range and mean of the results were carried out. The metal concentrations were comparably analyzed by bar graph.
A) Essential parameters
Table 1 shows the Drinking water contaminants and maximum admissible limit set by different national and international organizations. (For health risk and aesthetic value), released in favour of public health awareness. After the addition of anionic surfactant the desirable parameter coundtivity and pH showed an increase in the data.

Table 1. Drinking water contaminants and maximum admissible limit set by different national and international organizations. (For health risk and aesthetic value)
B) Desirable parameters
Table 2 shows the concentration of the Bore well water samples. Copper and Nickel was of the range 19.96- 40¼g/L without the addition of surfactant. while when surfactant was added the range decreased to17.61-25.83 ¼g/L. The range of the values of Iron 323-653 ¼g/L with surfactant the range decreased to 216-525 ¼g/L. These values are acceptable for drinking water according to WHO set limits for Iron .Iron is an essential trace element for Iron is an essential trace element for the human body; however, a high concentration of Iron gives water a bad taste and reddish colour (Caircross, 1990). The bore well water sample from shani shingnapur has the highest values for all the metals. After the addition of anionic surfactant the desirable parameter coundtivity and pH showed an increase in the data. Whereas the metal analysis showed an decrease in the data.

Table 2. Showing the effect of anionic surfactant on physical parameters of water.
The data for the essential parameters analyses were according to standards, the effect of surfactant was seen and it was enhancing in the case of coundtivity and pH whereas reducing in the case of metal analysis The hydrophilic head of anionic surfactant owns a negative charge (Myers, 2006).where it has potential to interact with contaminants bear’s cationic charge such as metal ion (Samper, et al., 2009). Because the surfactant has broken the hydrogen bond of the metal aqueous solution. After the decomposition of the hydrogen bond these surfactants at their CMC formed the micelle with the metal and protected it from being detected at a certain concentration. These micelles separated the metal priorly with the complexometric titration. As the titration started the pH was maintained to 10 and indicator EBT was added, less amount of EDTA was used. As all the metal ion were already separated form the sample as micelles, hence the EDTA was unable to from stable chelating complexes with the metal micelle formed. The above analysis shows that addition of anionic surfactant in small amount acts as inhibiter for the metal analysis. In the above structure the central area is for metal. Anionic surfactant binds the metal and inhibits it detection. Anionic surfactants are widely use in production of detergent powders since it is known to be more effective than other surfactant in different process. The study on the potential of anionic surfactant in removal of metals from water sample has confirmed that higher percentage of solute removal was achieved (Asaolu, 1997; Holmberg, 2001); (Landaburu-Aguirre, et al., 2009); (Danis et al. 2009) use of sodium dodecyl sulfate (SDS) as anionic surfactant in removal of heavy metal ion from wastewater has been widely explored by researchers (Yenphan et al. 2010) and Samper et al. (1998) proved 90% to 100% removal of ion Pb2+ was achieved using SDS. In the same way sodium lauryl sulphate is used for the analysis.

Table 3. Showing the metal analysis with and without surfactant.
The authors are thankful to Dr. Yasmeen F. pervez, Head of the department of Chemistry and Dr. Mahesh P. Principal, Chhatrapati Shivaji Institute of Technology for encouragement and lab facilities, also we are thankful to the management Shankara group of institutions for the support.
Copyright © 2026 Research and Reviews, All Rights Reserved