
ISSN (0970-2083)
ISSN (0970-2083)
DELIA TERESA SPONZA*
Department of Environmental Engineering, University of Dokuz Eylul, Buca Izmir, Turkey
Received: 05-Jun-2023, Manuscript No. ICP-23-107017; Editor assigned: 08-Jun-2023, PreQC No. ICP-23-107017 (PQ); Reviewed: 22-Jun-2023, QC No. ICP-23-107017; Revised: 03-Jul-2023, Manuscript No. ICP-23-107017 (A); Published: 31-Jul-2023, DOI: 10.4172/0970-2083.001
Visit for more related articles at Journal of Industrial Pollution Control
In this study the PAHs namely toluene, phenanthrene and chyrsene were effectively removed and recovered form a TFC polyamide FO reactor containing HF-C unit. The effect of feed flow rate on FO membrane reactor flux, effects of themperature and TMP on FO reactor Jw and Js/Jw, variation of zeta potantial versus pH were investigated. The optimized conditions for the maximum removals and recoveries of PAHs were as flows: E Jw and specific reverse solute (wastewater) flux (Js/Jw) ) of 150 L/m2.h and to 0.78 g/l at a draw flow rate of 67 L/h and a TMP of 28 bar at a temperature of 30°C. It was found that in FO reactor with a HF-C modüle traeating petrochemical industry wastewater the zeta potential was dependent to pH of wastewater. Total removals of PAH varied between 90% and 95% while the recoveries were 26 mg/l, 20 mg/l and 18 mg/l for toleune, phenanthrene and chrysene based on their initial concentrations of 5 mg/l.
Petrochemical, Wastewater, FO, HF-C unit, Toleune, Phenanthrene, Chrysene, PAH, Recover, Rejection, Treatment, Retentate, Permeate
Forward Osmosis (FO) is a membrane treatment process utilizing a gradient of osmotic pressure versus membrane as a driving force for water transport. Utilization of low pressure results with a decreasing fouling problem and succes with high rejection of solutes and low energy. Thin Film Composite (TFC) hollow fiber forward osmosis membranes utilized to remove, reject and recovery of pollutants and economical merit having pollutants (Minier-Matar, et al., 2016).
In conventional membrane processes (ultra or microfiltration, hollow fiber membranes) the recoveries and rejection of pollutants from leather, chemical and petrochemical ındustry was not effective. The utilization of hollow fiber module with high density, self-supporting property with homogeneous steady-state flow distribution provides a best mass transfer and regenerability of the membrane. Hollow fiber configuration for the FO process consist of an very-thin and dense selective layer, providing a huge permeability and solute rejection. A highly porous and thin membrane provides huge mechanical stability and lowered resistance to diffusion of the draw solute. This results by the utilisation of osmotic pressure as internal and external concentration polarization.
This provides excellent mass transfer, lowering the driving force (Benavides, et al., 2016). The choosen of optimal operational conditions such as suitable Draw Solution (DS) and draw recovery properties. The efficiency of FO process is significantly dependent on the solute rejection. The studies performed to remove the PAHs from chemical and petrochemical wastewater with FO membrane was very limited. No study was found to treath the petrochemical wastewaters using TFC polyamide-based HF-CFO membranes. Therefore, in this study the effects of the increasing feed flow rates (from 32 L/h up to 200 L/h) on the FO membrane reactor flux and specific solute flux to water flux (Js/Jw) were investigated in distilled and petrochemical industry water.
Zeta potential measurement were performed versus pH variations to determine the surface charge loading to FO membrane. The effects of increasing of TMP (from 3 to 30 bar) on variations of Jw and Js/Jw were investigated in distilled water and petrochemical wastewater at constant feed and draw flow rates of 200 L•h−1 and 125 L•h−1, respectively. The recoveries, the rejections of three PAHs namely toluene, phenanthrene and chrysene were invesigated in a real petrochemical industry wastewater. The effect of temperature and DS on the FO Jw was investigated.
The PAH analysis were performed in an agilent HPLC device. The surface charge of the FO membranes was measured with the streaming potential technique. The zeta potential was determined with a Surpass™ electro kinetic analyzer (Germany). The water permeability coefficient (A), solute permeability coefficient (B), were measured by increasing concentrations of NaCl (Khayet, et al., 2016).
Configuration of FO membrane reactor and HF-C module
A chlorinated membrane (HF-C) was used in the FO with a volume of 2 liter. The FO have 3 pumps (USA), each to supply DS and FS solutions to the HF-c module. Two pumps also were used to draw the treated waterpenetrate and the recovery of merit chemicals namely concentrate/retentate. Pressure was monitored with manometers. The concentrations of the draw solutes in the DS and Concentrate Solutions (CS) were monitored with two digital conductivity meters (Germany). Both FS and DS were stored in tanks at 21°C. The FO was operated during 50 min to reach steady-state conditions to find the constants values for Jw and Js/Jw (Haven, 2007).
Equations for operational conditions
The FO performance was detected by calculating Jw, Js and specific reverse solute flux (Js/Jw). The concentrate weight recorded on the balance was used to calculate Jw applying Equation (1):
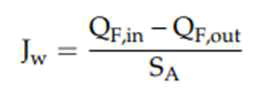
Here, QF,in and QF,out represent the volumetric flow rate of the feed and concentrate, respectively while SA represent the surface area of the membrane (Park, et al., 2018).
Js was measured using below equation.
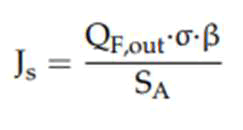
Where σ is the conductivity (μS•cm−1) of the concentrate and β is a proportionality coefficient describing the relation between conductivity and salt concentration. Here, β was calculated for salt and petrochemical wastewater as DS.
Js/Jw
Js/Jw can be used to define the yield of the FO process. It can be calculated by division of the Js by Jw.
TMP
TMP can be calculated according to below equation.
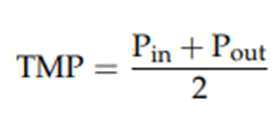
Where Pin and Pout are the pressures at the influent and at the outlet of the FO membrane.
Water permeability coefficient
The water permeability coefficient was calculated according to below equation.
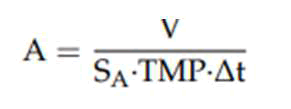
Where V is volume of the collected permeate sample and Δt is sample collection time.
Effect of the feed flow rate on FO membrane reactor flux containing HF-C module
Feed flow rate was increased from 80 up to 200 L/h to investigate the influence of the external concentration polarization on the active bound layer of the FO membranes. 0.05 mg/l CaCL2 was employed as a draw solution and operated at 45 L/h. For distilled water in the FO containing HF-C module Jw elevated from 45 L•m−2•h 180 L•m−2•h by varying the feed flow rate from 32 L/h up to 200 L/h (Fig. 1).
In petrochemical wastewater also the the same results was found and the Jw and specific reverse solute (wastewater) flux (Js/Jw)) increased to 150 L/m2.h and to 0.78 g/l. As a result, it can be concluded that flux and specitic solute (wastewater) flux were fonction of feed flow in deionized waster and petrochemical wastewater as uses as feed solutions. Draw flow rate was taken as 67 L/h the draw concentration was 235 mg/l total PAH concentration at a TMP of 28 bar.

Figure 1: Variation of Jw according to distilled water and petrochemical wastewater.Note: For deionized water; For petrochemical wastewater.
As shown in Fig. 2, the water flux (Jw) of the HF-C membranes is higher while the ratio of the specific solute flux to water flux (Js/Jw) is also increased with feed flow rate.
Js/Jw is higher and measured around 0.65 g/l for distilled water (Fig. 2). In the petrochemical wastewater this ratio elevated up to 0.98 g/l. This can be explained by the increase of the PAH permeation coefficient B and resulting in low solute retention of the FO membrane (Kim, et al., 2015).

Figure 2: Variation of Js/Jw depending on feed flow in FO for distilled water and petrochemical industry. Note: For distilled water; For petrochemical wastewater.
Zeta potential of the FO membrane reactor containing HF-C module
The electrostatic interactions between FO membrane surface and studied wastewater affects significantly the pollutants rejection present in the petrochemical wastewater. Zeta potential was measured to determine the surface charge loading to membrane. These measurements was illustrated in Fig. 3. It was found that the zetal potential varied between -2 mV and -18 mV in the inner surface of FO. These potentials varied depending of pH. In other words zeta potential was as a function of pH in the FO containing HF-C module (Chen, et al., 2019).

Figure 3: Variations in zeta potential depending to pH changes.
The isoelectric point was measured at 2.90. The isoelectric point around pH 3-5 was expected due to the properties of FO membrane and the doping of some carboxylic groups at the surface of the FO membrane. The increase of the the negative surface charge of the FO membrane can be attributed to negative zeta potential (Phuntsho, et al., 2014).
Effect of TMP on the variation of Jw and Js/Jw in distilled water and petrochemical wastewater
In the FO process the permeation was occurred in the difference in osmotic pressure between DS and FS due to the hydraulic pressure is significantly lower than the osmotic pressure difference in the FO. In order to detect the effects of high TMP loadings on the FO process, the feed and draw flow rates were kept constant as 200 L•h−1 and 125 L•h−1, respectively (Fig. 4).
As the TMP was increased from 3 bar to 30 bar, Jw increased from 38 up to 120 L•m−2•h−1 for distilled water while Jw imcreased to 112 from 28 L•m−2•h−1 in petrochemical wastewater. The results showed that significant variations in Jw and Js/Jw were obtained at elevated TMPs for both water types. Jw increases as the net osmotic pressure difference across the active layer is higher. The maximum concentration in the module that can be reached is the initial concentration of the DS and by increasing draw flow rate. Therefore, the plateau in Jw was observed at higher draw flow rates (Coday, et al., 2013).
Js/Jw was not reduced versus increase of TMP (Fig. 5). Greater increase in Jw for HF-C membranes caused a more severe dilutive ICP at the draw side of selective layer. As a result, the solute concentration difference between the draw side and feed side of the active layer was reduced; therefore, the driving force for solute diffusion was not diminished (Xie, et al., 2013).

Figure 4: Effects of TMP on Jw in FO. Note: For deionized water; For petrochemical wastewater.

Figure 5: Effects of TMP on Js/Jw. Note: For distilled water; For petrochemical wastewater.
Effect of DS on FO
Petrochemical wastewater containing PAH pollutants at different concentrations was used as draw solutes. Concentrations of draw solutes (toluene, phenanthrene chrysene with NaCl) were selected to obtain the same osmotic pressure and compare the DS generated. Distilled water was used as an FS. Feed flow rate and draw flow rate were kept constant at 180 L•h−1 and 90 L•h−1, respectively. At increasing DS values, the Jw obtained with HF-C modules was higher. In each step, Jw elevated with increasing of DS concentration since the driving force (osmotic pressure difference) is raised across the membrane (Seker, et al., 2017).
As shown in Fig. 6, by applying NaCl concentration varying from of 0.1 mg/l to 2 mg/l with 5 mg/l toluene corresponds to 9 bar and 29 bar osmotic pressure: The Jw increased from 13 L/m2.h up to 31 L/m2.h in FO. When NaCl with 5 mg/L phenanthrene was applied as a draw solute the osmotic pressure can be defined as 12 bar and 37 bar. Under these conditions Jw increased from 14 up to 37 L•m−2 •h−1.
When 5 mg/L chrysene with NaCl was used Jw increase from 11 L•m−2•h−1 to 19.0 L m−2•h−1 corresponding to osmotic pressures with 14 and 17 bars. The differences in osmotic pressure, originated from the hydrophilic and hydrophobic properties of the PAHs (Zaviska, et al., 2015).

Figure 6: Effects of osmotic pressure on the Jw in the presence of 3 different individual PAHs. Note: Jw (L/m2.h); Js/Jw (g/l).
Two different assumptions can be outlined: As the osmotic pressure was increased the Jw also elevated linearly. This exhibits that the potential in osmotic pressure is directly proportional to the flux Jw. The second regim is not relevant and a propotional relathionship between osmotic pressure and Jw was not detected. Crysene and phenantherene were more hydrophobic compared to toluene with low solubilities and resulting in low soluble PAHs and indirectly affects the Jw. Both PAHs decreased the diffusion coefficient of petrochemical wastewaters. Na+ and Cl− ions are both small enough to easily diffuse through the membrane support without hampering water transport, thus minimizing the ICP (Hu, et al., 2017).
Effect of temperature on FO performance
The temperature was elevated from 20°C to 45°C in distilled water as DS and petrochemical industry wastewater as FS in FO membrane reactor. The draw flow rates were kept at 150 L•h−1 and 60 L•h−1, respectively. The draw concentration contained 5 mg/l toluene, phenanthrene and chrysene, separately, while TMP was choosen as 25 bar. In the FO membrane reactor with an HF-C module Jw increased from 13 L•m−2•h−1 to 67 L•m−2•h−1 by increasing the temperature of distilled water and petrochemical industry wastewater from 20°C to 45°C (Yasukawa, et al., 2018).
Temperature increase affects significantly the diffusion rates and fluid viscosity. High diffusion rates of the liquids improve the transport inside of the FO. This reduce the ICP and results with higher Jw values. On the other hand liquid viscosity reduce the temperature of liquid and inhibits the solute diffusion. Reduced ICP increase the Js value. As shown in Fig. 7, Js/Jw increases from the 0.17 g/l at 20°C up to 2.2 g/l as the temperature was increased from to 45°C. This can be due to increase of Jw with versus temperature and advices solute diffusion that favors PAH and salt transport from the feed side to the draw side (Blandin, et al., 2016).

Figure 7: Effects of increasing temperature on Jw and Js/Jw values in petrochemical industry wastewater. Note: Jw (L/m2.h); Js/Jw (g/l).
Rejection of some PAH components in petrochemical industry wastewater
The mechanism providing the solute rejection occurred with osmotic pressure. This mechanism is the combination of electrostatic repulsion, transmembrane pressure, process recovery and concentration polarization.
The removals of total PAHs and some individual PAH removal yields in the treated penetrate and recoveries of these economical merit organics were performed from the concentrate/retentate of FO. These compounds were chosen due to their differences in molecular weight and their solubilities (Jin, et al., 2012).
Toluen chemical formula is C6H5CH3 with a molar mass 0f 92.14 g/mol and solubility is 0.54 g/l. Penenthrene with a formula of C14H10 consisting of three fused benzen rings and with a molecular weigth of 178 g/mol with low solubility and log KOW of 4.45. Crysene formula was C18H12 with a molar mass of 228 g/mol with low solubility of 0.0001 g/l. FS concentration was choosen as 180 mg•L−1 while the concentration of individual PAHs were 5 mg/l. 99% rejection was detected for 5 mg/l toluene with low molecular weigth and low carbon numbers in FO process, whereas 95% and 90% rejection yields were detected for phenanthrene and chrysene, respectively from the penetrate of the FO (Tab. 1). The recoveries of the toluene, phenanthrene and chrysen were 26 mg/l, 20 mg/l and 18 mg/l from the retentante of FO.
| Run | Removals % in the penetrate of FO | Recoveries (mg/l) in the retentate of FO | ||||||
|---|---|---|---|---|---|---|---|---|
| Total PAH | Toluene | Phenanthrene | Chrysene | Total PAH | Toluene | Phenanthrene | Chrysene | |
| 1 | 99 | 99 | 95 | 90 | 64 | 26 | 20 | 18 |
| 2 | 99 | 99 | 95 | 90 | 64 | 26 | 20 | 18 |
| 3 | 99 | 99 | 95 | 90 | 64 | 26 | 20 | 18 |
| 4 | 99 | 99.5 | 96 | 91 | 66 | 27 | 21 | 19 |
Tab. 1. Recoveries, removals of PAHs in the petrochemical industry wastewater using FO at a TMP of 25 bar at Jw=67 L•m−2•h−1 and at a temperature of 25°C.
As a conclusion FO membrane containing HF-C modules remove the PAHs present in the petrochemical industry wastewater regardless of higher Js/Jw values. Depending on solubilities, molecular mass and hydrophilicity properties of the PAHs has more pronounced effects on their removals in FO (Yamamoto, et al., 2015).
In this study FO membrane reactor with a HF-C module was used to treat the PAHs from a petrochemical industry. Toluene, phenanthere and chrysene recoveries were 99%, 95% and 90% depending their molecular stucture and solubility properties at a TMP of 25 bar at Jw=67 L•m−2•h−1 and at a temperature of 25°C in the retentate of FO. The recoveries from the retentate of FO were 26, 20 and 18 mg/l for toluene, phenanthere and chrysene, respectively.
In petrochemical wastewater the Jw and specific reverse solute (wastewater) flux (Js/Jw)) increased to 150 L/m2.h and to 0.78 g/l in FO. It was found that the specific solute (wastewater) flux was relevant of feed flow in FO. As the TMP was increased from 3 bar to 30 bar, Jw for distilled water in petrochemical wastewater elevated. Temperature increase elevated the diffusion rates and fluid viscosity in FO.
This hilgihted the transport of pollutants from the FO membrane. When the osmotic pressure was increased from 9 bar and 29 bar the Jw increased from 13 L/m2.h up to 31 L/m2.h in FO containing NaCl at increasing concentrations. When NaCl at increasing concentration with phenanthrene was applied as a draw solute to the FO the min and max osmotic pressures can be defined as 12 bar and 37 bar. In this case Jw increased from 14 up to 37 L•m−2•h−1.
[Crossref] [Google Scholar] [PubMed]
[Crossref] [Google Scholar] [PubMed]
[Crossref] [Google Scholar] [PubMed]
[Crossref] [Google Scholar] [PubMed]
[Crossref] [Google Scholar] [PubMed]
Copyright © 2026 Research and Reviews, All Rights Reserved