
ISSN (0970-2083)
ISSN (0970-2083)
1Department of Physics Education, Universitas Sultan Ageng Tirtayasa, Serang City, Indonesia
2Department of Education, Universitas Sultan Ageng Tirtayasa, Serang City, Indonesia
Received 03 March, 2018; Accepted 26 November, 2018
Visit for more related articles at Journal of Industrial Pollution Control
The amount of concentration and spreading distance of air pollutant emitted from industrial area has implications for changes in ambient air. The aim of research was to know the change of ambient air in Cilegon city. To achieve this objective, the research was conducted by emission analysis and distribution of SO2 and dust pollutants emitted from the industrial estate. Hence, the researchers used distribution of industrial pollutants by using Screen 3 software while the dispersion was used Lagrangian model. To validate the change of ambient air in Cilegon city, the measurement was done on 18 sample points. The results show that the amount of concentration of SO2 pollutants had an impact on the change of ambient air in Taman Sari Village, Pulomerak District. Meanwhile, the impact of dust pollution changes the ambient air in Kotabumi village, the district of Purwakarta and Gerem Village in Grogol District.
Pollutant emissions, Air pollutant dispersion, Air pollutant concentration, Ambient air, Air quality
Cilegon city has an industrial area consisted of three zones, namely: Ciwandan, Krakatau Steel (KS) and Pulomerak. The number of large and medium industries in the three regions, 81 industries (Badan Pusat Statistik Provinsi Banten, 2016). Meanwhile, the fuel used varies, depending on the type of production. According to the Industry Office of Cilegon city (2010) there are five types of fuel used: coal, residue, diesel fuel, High Speed Diesel (HSD), Pyrolisis Fuel Oil (PFO) and Marine Fuel Oil (MFO). The variety of fuel consumption has implications for various types of pollutants emitted (Watany, 2015). Based on the results of the air emissions test, the type of air pollutant emitted from the industrial area of Cilegon consists of: nitrogen dioxide (NO2), particles/dust, sulfur dioxide (SO2), carbon monoxide (CO), hydrocarbon (HC), and lead (Pb). The emission concentrations emitted vary depending on the fuel capacity used. The larger the fuel capacity used, the greater the concentration of pollutants emitted (Hasan, et al., 2013).
The fuel capacity used in Cilegon varies between (0.00237-255,000) kg/hour. The fuel capacity sequence was used as follows: HSD 2.37 x 10⁻³ kg/hour, diesel fuel 1.00 x 10³ kg/hour, PFO 3.72 × 10³ kg/hour, MFO 3.76 x 10³ kg/hour, and 80 × 103 kg/hour residue. Fuel with large capacity mainly coal with usage capacity (170-255) x 103 kg/hour. The fuel was also used by the steam power plant industry located in Pulomerak zone (DLHPE Cilegon, 2006). The amount of brick fuel capacity used has implications on the amount of SO2 and dust pollutants emitted from the industry (Fioletov, et al., 2016). Furthermore, according to (Ruhiat, et al., 2016) SO2 pollutants and dust emitted from the industrial area of Cilegon dispersion beyond the industrial area. This is as the implication of the height of the chimney used.
The stack used in Cilegon had the height varies between 10-275 meters, it indicates that the height of the stack has implications for the dispersion distances of emitted pollutants (Thomas, et al., 2012). The higher the stack used, the more distant the dispersion of pollutants emitted (Ruhiat, 2009). Differences in fuel usage capacity have implications on the height of the stack used, the greater the fuel capacity, the higher the stack used (Mercado and Masera, 2015). The same statement is also stated by (Jayalekshmi, et al., 2013), that the high variety of stack used has implications for the different concentrations of pollutants that fall to the ground. Furthermore, (Puspitarini and Lallement, 2012) states the amount of pollutant concentration will depend on the height of the stack used. The difference in concentration above, it occurred due to the mixing of the coating that takes place in turbulence and convective motion (Narayanachari, et al., 2014).
Mixing pollutants in the air layer emitted from the industry has also implications for changes in ambient air, so that air quality in the area becomes decreased (Kgabi, et al., 2014). Some efforts to determine changes in ambient air were conducted the study of emissions and the dispersion of air pollutants from industrial areas. As for the air pollutants studied in this study, the pollutants SO2 and dust were concerned with the amount of coal fuel capacity used. To know the amount of emission and concentration as well as dispersion distance of Screen3 software air pollution. Meanwhile, to examine the change of pollutant concentration, the Lagrangian model was used to describe the change of air pollutant concentration at any time in each region (Arya, 1999). This is done because of the difference in fuel capacity and the height of the chimney used. According to (Palau, et al., 2006) Lagrangian models can detect changes in pollutant concentrations at ground level emitted from chimneys of different heights.
To know the emission and dispersion distance of air pollutant from industrial area is done by modeling through several stages. The first stage was analyzing the type of pollutants and emission discharge of each source. The second stage was an analysis of the dispersion of air pollutants from each stack using Screen3 software. The third stage was analyzing the amount of air pollutant concentration in each region using Lagrangian model. According to (Cengel and Cimbala, 2006) Lagrangian model examines the flow model in particle concept.
Emission discharge was calculated by using the general formula as follows:

with: EF=emission factors, Activity=energy consumption (input energy), a=type of fuels used, b=sector/type of activities, and c=emission controlled technology (pollution control). To estimate the particle dispersion in the atmosphere, using the thermal conduction equation. The equation, the pattern of its distribution is related to the source (Sellers, 1965). The form of thermal conduction equation was stated as follows:
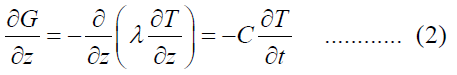
By assuming soil homogeneous, the equation changes to:
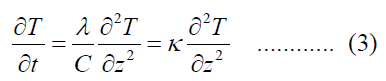
with κ = λ /C which is limited as thermal diffusivity. The atmospheric diffusion is analyzed and developed from equation (2), as follows.
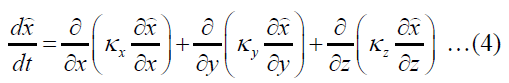
The right-hand side of equation (3) represents the average concentration change of the particles in the air pack, whereas κx , κz and κz is diffusivity eddy. The rate of concentration was stated by unit of gram, curie, or particle per meter cubik (ppm).
Furthermore, to know the ambient air in Cilegon city, the researchers conducted by measurement. Meanwhile, to determine the changes in ambient air, the comparison of ambient air measurement results in a quarterly period. Ambient air measurements were performed at 18 sample points using high volume sampling and paper tape sampling methods. The high volume sampler method is used to measure the suspended concentration in ambient air by weighing the particulate matter retained on the filter surface by calculating the volume of inhaled air. The sample was used for both qualitative and quantitative analyzes of compounds present in particle form. The sampling was conducted for 24 hours with air flow velocity of 1.70 m3/min. Furthermore, the paper tape sampling method was based on the measurement of light transmission due to precipitation (soiling) or darkening of the previously clean filter. The measurements were done by separating large particles from the atmosphere by the area and speed of certain airflow. To find out the trend of ambient air change measurement result done by using regression equation.
To find out the pollutant discharge emitted from the industry, equation (1) was used. The results of the analysis with these equations were shown in Table 1. Based on the table, the emitted SO2 pollutant ranges from 0.00-1.275.00 gr/s, and the dust was between 0.00-63.75 gr/s. The biggest SO2 and dust contaminants were emitted from Indonesia Power located in Pulomerak zone. The SO2 emulsifiers emitted from the Ciwandan zone were only 3% while the KS zone was only 2%, while the dust from the Ciwandan zone 10% of the KS zone was 19% of the Pulomerak zone. The amount of pollutants SO2 and dust emitted from Indonesia Power, due to the industry used a very large fuel capacity. The fuel used by the industry was coal with a capacity of 680-765 tons/hour, while other industries only used residue fuel, with cotton 10% while MFO is 58% of capacity of Indonesia Power. Dealing with the relationship between fuel capacity and the use of stack, Indonesia Power with the capacity of the fuel, using seven stacks with a height between 200-275 meters, while the height of the stack in Ciwandan zone between 30-60 meters, and KS zone between 30-80 meters. The height of the stack used had the implications for the distances of the emitted air pollutants. To study the range of air pollutants emitted from the industry used software screen 3.
| No | Company | Type of fuel | Number of fuel (ton/jam) | Element of content | Efficiency | Emission | |||
|---|---|---|---|---|---|---|---|---|---|
| SO2 (%) | Dust (%) | SO2 (%) | Dust (%) | SO2 (gr/det) | Dust (gr/det) | ||||
| 1 | Krakatau Daya Listrik | Residue | 80.00 | 0.08 | 0.02 | 0.00 | 0.00 | 33.33 | 4.44 |
| 2 | Chandra Asri | Diesel fuel | 1.00 | 0.05 | 0.00 | 0.00 | 0.00 | 0.25 | 0.00 |
| PFO | 3.72 | 0.01 | 0.00 | 0.00 | 0.00 | 0.27 | 0.00 | ||
| MFO | 3.76 | 0.01 | 0.01 | 0.00 | 0.00 | 0.21 | 0.10 | ||
| 3 | Cigading | Residue | 80.00 | 0.05 | 0.02 | 0.03 | 0.00 | 22.22 | 4.44 |
| 4 | Indonesia Power | ||||||||
| Unit 1 - 4 | Coal | 680.00 | 0.30 | 6.00 | 0.00 | 99.50 | 1133.33 | 56.67 | |
| Unit 5 - 7 | Coal | 765.00 | 0.30 | 6.00 | 0.00 | 99.50 | 1275.00 | 63.75 | |
| 5 | Krakatau Steel | HSD | 170.70 | 0.00 | 0.00 | 0.00 | 0.00 | 0.00 | 0.00 |
| MFO | 444.44 | 0.01 | 0.01 | 0.00 | 0.00 | 24.69 | 12.35 | ||
Table 1: Air pollutant emissions from industrial area in Cilegon city.
The screen3 software used the following inputs such as; pollutant emission, temperature, wind speed and height of stack. The output of the software will be obtained the distance of air pollutant distribution in various atmospheric stability. Therefore, it was conducted the measurement of wind velocity and temperature area. Wind speeds in industrial estates range from 0.2 to 4.0 m/s with temperatures ranging from 21.0-34.4 °C. Average wind speed and ambient temperature in Cilegon industrial area are: 2.5 m/s and 30 °C, the result of model ruuning under those conditions, for SO2 and dust pollutants are shown in Table 2 below.
| Atmospheric stability | KS zone | Ciwandan zone | Pulomerak zone | ||||||
|---|---|---|---|---|---|---|---|---|---|
| Concentration (µg/m3) | Space of distance (m) | Concentration (µg/m3) | Space of distance (m) | Concentration (µg/m3) | Space of distence (m) | ||||
| SO2 | Dust | SO2 | Dust | SO2 | Dust | ||||
| A | 54.33 | 27.18 | 1000 | 49.52 | 9.89 | 1000 | 592.40 | 33.32 | 1155 |
| B | 53.38 | 26.70 | 1387 | 47.12 | 9.42 | 1377 | 237.20 | 13.34 | 4320 |
| C | 40.69 | 20.35 | 2595 | 36.21 | 7.24 | 2566 | 148.90 | 8.37 | 9876 |
| D | 16.19 | 8.10 | 8632 | 14.62 | 2.92 | 8356 | 4.82 | 0.27 | 18800 |
| E | 9.16 | 4.58 | 10371 | 11.99 | 2.40 | 8707 | 1.07 | 0.06 | 18800 |
Table 2: Distances of air pollutants with Screen 3
Based on Table 2 above, the results of Screen3 SO2 pollutant software and dust on various atmospheric stability with the same wind and temperature speeds showed the amount of concentration and spacing of different distances. Turner's atmospheric stability in (Cooper and Alley, 1994) consists of: highly unstable (A), medium unstable (B), slightly unstable (C), neutral (D), somewhat stable (E), and stable (F). Based on the results of the analysis, the atmospheric stability in Cilegon city in the morning, noon, afternoon and evening has variations between A-E. This phenomenon shows that the air condition in Cilegon city is between steady stable until quite stable. The distance distribution between atmospheric stability E and A, SO2 and dust pollutants in each zone varies. The ratio of the distribution of SO2 and dust pollutants in the KS Zone between the stability of E and A is 10.37, in the KS zone of 8.71, while in the Pulomerak zone of 16.28. Meanwhile, the concentration of pollutants emitted is getting smaller. The amount of pollutant emitted from Pulomerak zone due to a very high stack used, so emissions dispersion beyond the industrial area. To know the distribution of contaminants SO2 and the dust that spread in Cilegon city used equation (4). The result of running the program using the equation, the distribution of pollutants in Cilegon city is shown in (Fig. 1).

Fig. 1: Contour dispersion SO2 and dust in Cilegon City.
Based on (Fig. 1), it shows that the concentration of SO2 and dust spread in Cilegon city emitted from the industrial estate, with an average wind speed of 2.5 m/s with wind direction from West to East. The analysis results showed that with wind velocity 2.5 m/s SO2 and dust spread from Tamansari village towards Suralaya Village, Pulomerak district. Then from the village of Kotasari, Grogol district SO2 spread to the village of Kotabumi village of Purwakarta district. The concentration of SO2 ranged from 21.843 μg/m3 to 24.573 μg/m3 whereas in Pulomerak subdistrict spread from Tamansari Village to Suralaya Village ranged from 40.228 μg/m3 to 45.256 μg/m3. While dust pollutants, concentrations in the same place between 97-277 μg/m3 and 259-629 μg/m3, the second distribution of pollutants, is shown in (Fig. 2).

Fig. 2: Dispersion of SO2 and dust in Cilegon City.
The measurement of ambient air
Measurements of air pollutant concentrations were carried out over five periods in November 2015 and then July and November 2016 and July and August 2017. Monitoring was conducted at 18 sample points spread throughout the Cilegon city. Monitoring the concentration of SO2 and dust pollutants at each sample point, the monitoring results were shown in Table 3.
| No | Location of measurement | Concentration SO2 (µg/m3) | Concentration dust (µg/m3) | ||||||||
|---|---|---|---|---|---|---|---|---|---|---|---|
| Locations | Village | Districts | P-1 | P-2 | P-3 | P-4 | P-1 | P-2 | P-3 | P-4 | |
| 1 | Kelapa Tujuh | Suralaya | Pulomerak | 3.90 | 6.30 | 6.36 | 6.39 | 107 | 121 | 130 | 109 |
| 2 | Pasar Merak | Taman Sari | Pulomerak | 9.35 | 13.93 | 11.19 | 16.93 | 156 | 264 | 201 | 260 |
| 3 | ASDP Merak | Taman Sari | Pulomerak | 14.20 | 13.75 | 20.69 | 55.75 | 240 | 385 | 235 | 247 |
| 4 | Cikuasa Baru | Gerem | Grogol | 11.41 | 13.39 | 15.23 | 16.25 | 126 | 135 | 144 | 213 |
| 5 | Cikuasa Lama | Gerem | Grogol | 8.07 | 13.88 | 13.98 | 15.88 | 190 | 205 | 157 | 183 |
| 6 | Depan PENI | Gerem | Grogol | 15.38 | 11.42 | 20.69 | 41.42 | 432 | 518 | 306 | 352 |
| 7 | Kruwuk | Rawa Arum | Grogol | 6.22 | 10.73 | 11.11 | 13.73 | 186 | 109 | 136 | 207 |
| 8 | Komp. Arga Baja Pura | Kota Sari | Grogol | 5.14 | 11.26 | 5.21 | 11.26 | 120 | 108 | 108 | 153 |
| 9 | Perum KS | Kota Bumi | Purwakarta | 11.74 | 4.85 | 5.89 | 14.75 | 409 | 412 | 432 | 452 |
| 10 | Palem Hills | Kota Bumi | Purwakarta | 5.42 | 7.65 | 4.43 | 7.65 | 90 | 96 | 52 | 82 |
| 11 | Rel KA | Kebon Sari | Citangkil | 3.55 | 3.68 | 3.79 | 4.23 | 125 | 131 | 132 | 145 |
| 12 | Telkom Warna Sari | Warna Sari | Citangkil | 11.23 | 11.24 | 12.72 | 21.24 | 226 | 223 | 87 | 196 |
| 13 | Pelindo | Tegal Ratu | Ciwandan | 8.15 | 8.25 | 14.04 | 13.25 | 210 | 209 | 209 | 381 |
| 14 | Randakari | Randakari | Ciwandan | 3.45 | 8.85 | 5.00 | 10.85 | 150 | 138 | 94 | 134 |
| 15 | Pengabuan | Kepuh | Ciwandan | 9.91 | 9.94 | 5.98 | 11.94 | 68 | 67 | 93 | 37 |
| 16 | Cilodan | Gunung Sugih | Ciwandan | 10.12 | 10.12 | 10.42 | 16.12 | 126 | 125 | 97 | 177 |
| 17 | Kedung Bulus Pabuaran | Ciwedus | Cilegon | 15.37 | 8.61 | 17.32 | 14.57 | 281 | 191 | 113 | 217 |
| 18 | PCI | Kedaleman | Cibeber | 7.26 | 7.62 | 14.25 | 13.34 | 198 | 207 | 211 | 235 |
Table 3: The result of measurement of ambient air in Cilegon City.
Based on the table, it is generally seen that the concentration of SO2 and dust at each sample point has increased. Measurements were made at 18 sample points in a quarterly period, in this research, it was conducted four times for the measurement. The measurement results at the sample point, the concentration range of SO2 between 3.45-55.75 μg/m3 while the dust concentration between 37-518 μg/m3. Changes in ambient air, as a result of SO2 pollutants occured in Taman Sari village, Pulomerak district, while the change of ambient air, as a result of dust pollutants occurred in the Village of Kotabumi, district of Purwakarta and Gerem Village, Grogol district.
The amount of coal fuel capacity and the height of the chimney used has implications for the concentration and dispersion distances of SO2 and dust emitted. The concentration of SO2 and dust is inversely proportional to the spreading distance emitted. The farther the emission distance the less concentrated pollutants emitted. Another thing related to the distribution of air pollutants is the stability of the atmosphere. Cilegon city has A-E stability, SO2 and dust concentration changes in each atmospheric stability shown in (Fig. 3) below.

Fig. 3: Relationship between concentration SO2 and dust with atmosphere stability, a) Concentration SO2 b) Dust concentration.
Furthermore, the distance of the pollutant distribution is inversely proportional to the concentration, the highest concentration in stability A while at stability E is small concentration. Meanwhile, the farthest distance occurs at the stability of E while the closest distance occurs to the stability of A, as shown in (Fig. 4). The large amount of SO2 pollutants and dust emitted from the industry had implications for changes in ambient air outside industrial zones.

Fig. 4a and 4b: Relationship between distribution distance of SO2 with atmosphere stability, a) Polluntant SO2, b) Dust pollutant.
The concentration of SO2 and dust contaminants emitted from the industry spread to the outside of the industrial estate due to the changes in ambient air in some areas of Cilegon city. The results showed that SO2 concentration had an impact on ambient air change in Taman Sari Village, Pulomerak district. Meanwhile, the impact of increased concentration of dust pollutants occurred air changes in the Village of Kotabumi, Purwakarta district and Gerem Village, Grogol District.
The researchers addressed salutation and appreciation to the Chairman at the University of Sultan Ageng Tirtayasa. Hopefully the results of this research will be taken into account for the future contribution to maintain air quality in Cilegon city.
Copyright © 2026 Research and Reviews, All Rights Reserved