
ISSN (0970-2083)
ISSN (0970-2083)
Arpit Mehta, Vishwa Shukla*
Department of Environment Engineering, Lalbhai Dalpatbhai College of Engineering, Ahmedabad, Gujarat, India
Received: 05-Aug-2023, Manuscript No. ICP-23-109359; Editor assigned: 09-Aug-2023, PreQC No. ICP-23-109359 (PQ); Reviewed: 24-Aug-2023, QC No. ICP-23-109359; Revised: 31-Aug-2023, Manuscript No. ICP-23-109359 (A); Published: 06-Sep-2023, DOI: 10.4172/0970-2083.39.03.004
Citation: Mehta A, Shukla V. Volatile Organic Compounds (VOC) Emissions from Identified Industrial Sector of Ankleshwar, India. J Ind Pollut Control. 2023;39:004.
Copyright: © 2023 Shukla V, et al. This is an open-access article distributed under the terms of the Creative Commons Attribution License, which permits unrestricted use, distribution, and reproduction in any medium, provided the original author and source are credited.
Visit for more related articles at Journal of Industrial Pollution Control
The study of the industrial Volatile Organic Compounds (VOCs) emission is essential due to presence of many large industries including chemical, ceramic, pharmaceutical, textile, automobile, refining and petrochemicals, coke production, organic chemical, pesticides which are potential industries to emit high level of VOCs. VOCs are compounds with low boiling points that easily escape into the atmosphere and can travel longer distances, posing potential adverse effects on human health, contributing to the formation of ground- leve l ozone and secondary organic aerosols through photochemical reactions. Ankleshwar being one of Asia’s largest chemical zones with over 2,000 industries has faced air quality concerns due to high levels of pollutants such as particulate matter, nitrogen oxides, Sulphur oxides and VOCs. The emission inventory of VOCs is conducted by considering emission factors for different emission sources including raw materials and production processes. The spatial distribution analysis using a GIS reveals that VOC concentrations are highest in the GIDC area of Ankleshwar where major large-scale industries are located. To assess the trend of VOC emissions in Ankleshwar data was collected over the past four years indicating average VOC emissions of 6.22 µg/m3, 10.88 µg/m3, 5.51 µg/m3, and 3.65 µg/m3, respectively. To improve the accuracy of VOC emission estimates emission factors specific to each emission source and industrial sector were derived from literature surveys and reviews. Hence, in present study an attempt has been made to assess the VOC pollution over Ankleshwar city.
Volatile organic compounds, GIS, Ground level ozone, Photochemical reactions
The term Volatile Organic Compound (VOC) lacks a universally accepted and widely supported defi- nition. However, from a chemistry perspective it refers to any organic compound excluding a few exceptions that contains carbon and exhibits volatility (it readily evaporates or vaporizes under normal conditions). Volatile Organic Compounds (VOCs) are organic chemicals that have a high vapor pressure with low water solubility at room temperature. VOCs are found in a wide range of products, including paints, solvents, cleaning supplies, and personal care products, as well as in vehicle exhaust and industrial emissions. Exposure to VOCs can cause a range of health effects, depending on the specific compound and the level of exposure. Short-term effects can include eye, nose, and throat irritation, headaches, dizziness, nausea, and long-term exposure to some VOCs has been linked to cancer and other serious health problems. When VOCs react with other chemicals in the atmosphere, they can contribute to the formation of ground-level ozone, which is a major component of smog. In India, the absence of standardized regulations for VOCs with the exception of benzene in ambient air poses chal- lenges for regulatory and enforcement authorities in taking appropriate actions. Estimating volatilization is a challenging task because of the uncertainties associated with estimating factors such as solvent usage, temperature, and application methods.
The development of effective strategies to control VOCs requires the quantification of ambient concentrations and identification of emission sources of these pollutants. Classification of VOCs can be done on the basis of boiling point:
Very Volatile Organic Compounds (VVOC)
VVOC are the compounds whose temperature typically ranges from 0°C to 100°C.
Volatile Organic Compounds (VOC)
VOC are the compounds whose temperature typically ranges from 100°C to 260°C.
Semi Volatile Organic Compounds (SVOC)
SVOC are the compounds whose temperature typically ranges from 260°C to 500°C.
Polycyclic Organic Compound (POM)
POM is the compounds whose temperature is greater than 380°C. Classification based on toxicity:
Highly Harmful
Highly harmful VOCs includes Benzene, Vinyl Chloride and 1,2 dichloromethane.
Class A VOCs
Class A VOCs refer to those volatile organic compounds that have the potential to significantly contribute to the formation of photochemical ozone, stratospheric ozone depletion, or global warming. These are considered as having a medium degree of harmfulness. Class A VOCs includes carbon tetrachloride, 1,1,1-trichloroethane, trichloroethylene and trichlorotoluene.
Class B VOCs
Class B VOCs are the majority of VOCs that are considered to have a lower degree of harmfulness compared to Class A VOCs. Class B VOCs includes Butane and Ethyl acetate.
VOCs can also contribute to the formation of acid rain and the depletion of the ozone layer. To reduce exposure to VOCs, it is important to use products and materials that have low levels of these compounds. Additionally, reducing the use of fossil fuels and implementing regulations on industrial emissions can help to decrease the overall levels of VOCs in the environment (Chandra, et al., 2021). Unlike many other countries that have established standards for the environmental sampling and analysis of VOCs, India lacks such guidelines. Consequently, it becomes crucial to promptly implement precautionaryc measures in the absence of these standards.
Study Area
Ankleshwar is a city located in the Bharuch district of Gujarat, India. It is situated on the banks of the river Narmada and is about 10 kilometers from Bharuch. The city has a population of approximately 1,50,000 people. Ankleshwar is known for its industrial development with several large-scale industries and factories located in and around the city. Some of the major industries in Ankleshwar include chemicals, pharmaceuticals, textiles, and engineering. The city also has a thriving agricultural sector, with the production of crops such as cotton, tobacco, and bananas. Determination of PH and Concentrations of SO2, CO2 and NO2 in the Rainwater.
The sources of industrial VOCs can be classified into four types as per the literature survey – including the production of VOCs, storage and transport, the industrial processes using VOCs as a raw material and the use of VOCs products. In this present study VOC emitting industries were classified based on two parameters production of VOCs and industrial processes using VOCs as a raw material. The Technical Guide on Compiling Atmospheric Volatile Organic Compounds Source Inventory which is issued in August 2014 is employed. The methodology majorly includes: the identification of major sources of VOCs emission in the study area, activity data collection from Gujarat Pollution Control Board, Ankleshwar, Emission Factor (EF) analysis, and the method of calculation of emissions. The sources of industrial VOCs can be classified into four types as per the literature survey including the production of VOCs, storage and transport, the industrial processes using VOCs as a raw material and the use of VOCs products. The calculation formula for different emission sources varied based on the availability of activity data. The emission factor for the annual VOC emissions.
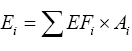
where E stands for the total emissions from each emission source, EF is the emission factor, A represents activity data and i represents the emission source.
Using a material balance approach can also provide reliable average emission estimates for specific sources which may even be more accurate than emission tests in certain cases. Typically, material balances are most appropriate for situations where a significant amount of material is lost to the atmosphere such as with sulphur in fuel or solvent loss in an uncontrolled coating process (Hamid, et al., 2020). For the present study emission factor method as well as material balance methods are adopted for determination of VOC emission over Ankleshwar (Fig. 1).

Figure 1: Approach to emission estimation.
For the VOC emission estimation using emission factor method, industries are classified and considered based on two sectors namely production of VOCs and industrial processes using VOCs as a raw material.
Data Collection
Activity data: The data for the VOCs emitting industries are obtained from regional office GPCB, Ankleshwar (2022-2023) (Table 1). As a secondary data the production capacity per month of each potential VOCs emitting industries are collected. Total 117 number of different category of industries are located within Ankleshwar. Major following categories of VOCs emitting industries are methanol production, benzene production, synthesis ammonia, acrylic, cement, production of synthetic detergent, ink production, pharmaceutical industries, chemical industries, steel production, tyre production and production of synthetic rubber. In Ankleshwar industries like Methanol production, Benzene production causes major VOCs emission. In this study, yearly average concentration of Benzene is prepared for four years (2019-2022) from which in the year 2020 the highest concentration is observed which is about 10.88 µg/m3 which violated NAAQS, 2009 annual average standard of benzene.
| Sector | Sources |
|---|---|
| Production of VOCs | Synthesis ammonia |
| Benzene production | |
| Methanol production | |
| Industrial processes using VOCs as raw material | Acrylic |
| Cement | |
| Production of synthetic detergents | |
| Ink production | |
| Polyester | |
| Steel production | |
| Yield of finished sugar | |
| Synthetic rubber | |
| Tyre production |
Tab. 1. Source classification and activity level of the major industrial VOC emission inventory
Emission factors: An emission factor is a value that relates the amount of a specific pollutant emitted by a particular source to an activity or process. Emission factors are typically expressed as the amount of pollutant emitted per unit of activity, such as per unit of fuel burned, per unit of electricity generated, or per unit of product produced (Table 2). Emission factors are used in air quality modelling and emissions inventories to estimate the amount of pollutants released into the atmosphere from various sources. These estimates can be used to identify sources of pollution and to develop strategies for reducing emissions. Emission factors can vary depending on the type of pollutant, the source of emissions, and the specific activity or process being considered. For example, the emission factor for carbon dioxide from burning coal will be different than the emission factor for carbon dioxide from burning natural gas. Emission factor is key indicator relating to the quantity (weight) of the pollutants emitted from a unit of activity of the source, emission factors have a direct impact on the estimation of pollutant emissions. It is critical to obtain the emission factors with a high accuracy for the preparation of an emission inventory (Li, et al., 2020; Jong, et al., 2020; Maimaiti, et al., 2021).
| Sectors | Sources | Activity data | Emission factor | Unit |
|---|---|---|---|---|
| Production of VOCs | Basic chemical raw material manufacturing | Methanol production | 5.55 | g/kg products |
| Benzene production | 0.55 | g/kg products | ||
| Synthesis ammonia | 4.72 | g/kg products | ||
| Industrial processes using VOCs as raw material | Production of synthetic material | Acrylic | 37.1 | g/kg product |
| Polyester | 0.7 | g/kg product | ||
| Yield of finished sugar | 8 | g/kg sugar | ||
| Production of synthetic rubber | 7.17 | g/kg product | ||
| Manufacture of lime, cement and gypsum | Cement | 0.177 | g/kg of product | |
| Tyre manufacturing | Tyre production | 0.91 | kg/a | |
| Commodity production | Production of synthetic detergent | 0.025 | kg/t | |
| Steel making | Steel production | 0.2 | g/kg steel | |
| Coating production | Ink production | 50 | g/kg product | |
Tab. 2. Emission factor used in this study.
| Sr. No. | During production process | Number of industries | Production (MT) |
|---|---|---|---|
| 1. | Synthesis ammonia | 14 | 5495.26 |
| 2. | Benzene production | 26 | 1725.17 |
| 3. | Methanol production | 39 | 7119.8 |
| Total | 79 | 14340.23 |
Tab. 3. Data of the industries emitting VOCs during production process.
Industrial VOCs Emission in Ankleshwar City
The secondary data are collected from Gujarat Pollution Control Board Ankleshwar, Gujarat. As a secondary data the production capacity per month of each potential VOCs emitting industries are collected. Based on data collected, Methanol production industry is observed highest in number which contributes 49% of sector VOCs during production process in the Ankleshwar region (Table 3) (Figs. 2 and 3) (Mimi, et al., 2020; Rajab, et al., 2016).

Figure 2: Classification according to number of industries in the sector of production process.

Figure 3: Classification based on production capacity in the sector of production process.
The total VOCs emission is calculated using emission factor method and it is observed that Methanol production is emitting 70% of total emission in the sector during production process (Fig.4) (Table 4).
| Sr. No. | During production process | Number of industries | Total production capacity (MT/month) | Total VOCs emission (kT/annum) |
|---|---|---|---|---|
| 1. | Synthesis ammonia | 14 | 5495.26 | 0.2029 |
| 2. | Benzene production | 26 | 1725.17 | 0.0243 |
| 3. | Methanol production | 39 | 7119.8 | 0.5254 |
| Total | 79 | 14340.23 | 0.7526 |
Tab. 4. Total VOCs emission load from sector during production process.

Figure 4: Distribution based on total VOCs emission load during
production process. Note:

Based on the data collected, Acrylic industry was observed highest in number which contributes 21% of sector industrial processes using VOCs as a raw material in the Ankleshwar region (Table 5) (Fig. 5).
| Sr. No. | Industrial processes using VOCs as raw material storage | Number of industries | Production (MT) |
|---|---|---|---|
| 1. | Acrylic | 8 | 164.9 |
| 2. | Cement | 6 | 4861.1 |
| 3. | Production of synthetic detergents | 3 | 6.45 |
| 4. | Ink production | 3 | 310.3 |
| 5. | Polyester | 2 | 65 |
| 6. | Steel production | 6 | 541.87 |
| 7. | Yield of finished sugar | 2 | 95.4 |
| 8. | Synthetic rubber | 1 | 25 |
| 9. | Tyre production | 7 | 937.22 |
| Total | 38 | 7007.24 |
Tab. 5. Data of the industries emitting VOCs as raw material storage.

Figure 5: Classification according to number of industries in the sector of industrial process using VOCs as raw material storage. 


The total VOCs emission is calculated using emission factor method and it is observed that Ink production is emitting 51% of total emission in the sector industrial processes using VOCs as a raw material (Table 6 and Figs. 6 and 7).
| Sr. No. | Industrial processes using VOCs as raw material storage | Number of industries | Total production capacity (MT/month) | Total VOCs emission (kT/annum) |
|---|---|---|---|---|
| 1. | Acrylic | 8 | 164.9 | 0.1383 |
| 2. | Cement | 6 | 4861.1 | 0.04 |
| 3. | Production of synthetic detergents | 3 | 6.45 | 0.0000039 |
| 4. | Ink production | 3 | 310.3 | 0.306 |
| 5. | Polyester | 2 | 65 | 0.000231 |
| 6. | Steel production | 6 | 541.87 | 0.00217 |
| 7. | Yield of finished sugar | 2 | 95.4 | 0.0421 |
| 8. | Synthetic rubber | 1 | 25 | 0.00215 |
| 9. | Tyre production | 7 | 937.22 | 0.0666 |
| Total | 38 | 7007.24 | 0.5975 |
Tab. 6. Total VOCs emission from sector industrial processes using VOCs as raw material

Figure 6: Classification based on production capacity in the sector of industrial processes using VOCs as raw material storage.

Figure 7: Distribution based on total VOCs emission load of
industrial processes using VOCs as raw material. 


Figure 8: VOCs emission over Ankleshwar city accoding to zone
division in sector during production process. 

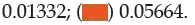

Figure 9: Cover Ankleshwar city accoding to zone division in sec -
tor industrial processes using VOCs as a raw material. Note: 


Spatial Distribution of Industrial Vocs Emission Over Ankleshwar City
The map shows spatial distribution of various production industries across the Ankleshwar region. The stack bar in the map denotes the emission in kg/D and the point feature on the map shows the VOCs emitting industries in Ankleshwar (Regina, et al., 2010; Xiurui, et al., 2008; Xiaohong, et al., 2018.). The numbers shown in the map indicates total count of VOCs emitting industries in each zone (Figs.8 and 9). It can be concluded from the map that most of the VOCs emitting industries are located in GIDC area of Ankleshwar region.
The total number of VOCs emitting industries located within Ankleshwar GIDC as per secondary data collected is 117. Out of total number of industries, 79 from sector during production process and 38 from sector industrial processes using VOCs as raw material during year 2022- 2023. The sector during production process contributes 55% of total VOCs emissions for year 2022-2023. The sector industrial processes using VOCs as raw material contributes 45% of total VOCs emissions for year 2022-2023. During production process sector contributing to overall VOCs emission industries located within Ankleshwar GIDC is more. Through GIS mapping, policy can be made in order to control VOCs emitting industries located within GIDC area. GIS mapping concluded that zone 2 of sector during production process which is Methanol industry have maximum VOCs emission in that particular divided zone and emission load of 0.05664 kT/annum. Zone 5 of sector industrial processes using VOCs as a raw material industries namely ink production, polyester have maximum VOCs emission in that particular divided zone and emission load of 0.18 kT/annum. In order to develop Emission Factor (EF) by mass balance concept requires more detailed information regarding production capacity, manufacturing process, efficiency of each Unit Operation & Unit Process and mitigation measures employed.
[Crossref] [Google Scholar][PubMed]
[Crossref] [Google Scholar][PubMed]
[Crossref] [Google Scholar][PubMed]
Copyright © 2026 Research and Reviews, All Rights Reserved